Open Access
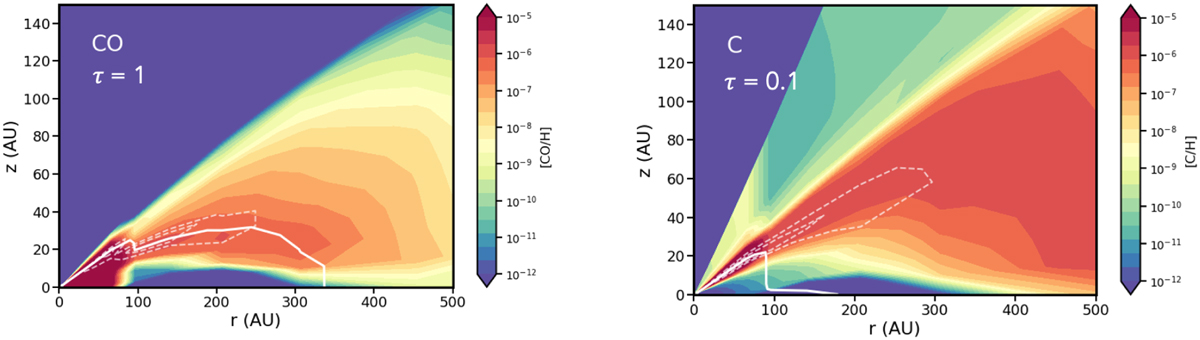
Fig. 7
Download original image
Abundance maps for CO an [CI] in HD 163296 obtained with DALI modeling. The dashed white lines enclose areas with 75 and 50% of the emission expected for CO J = 2 − 1 and [CI]= 3P1 − 3P0. The solid white line shows the line emission, τ = 1, and τ = 0.1 surfaces of CO and [CI] line emission, respectively.
Current usage metrics show cumulative count of Article Views (full-text article views including HTML views, PDF and ePub downloads, according to the available data) and Abstracts Views on Vision4Press platform.
Data correspond to usage on the plateform after 2015. The current usage metrics is available 48-96 hours after online publication and is updated daily on week days.
Initial download of the metrics may take a while.