Fig. 1
Download original image
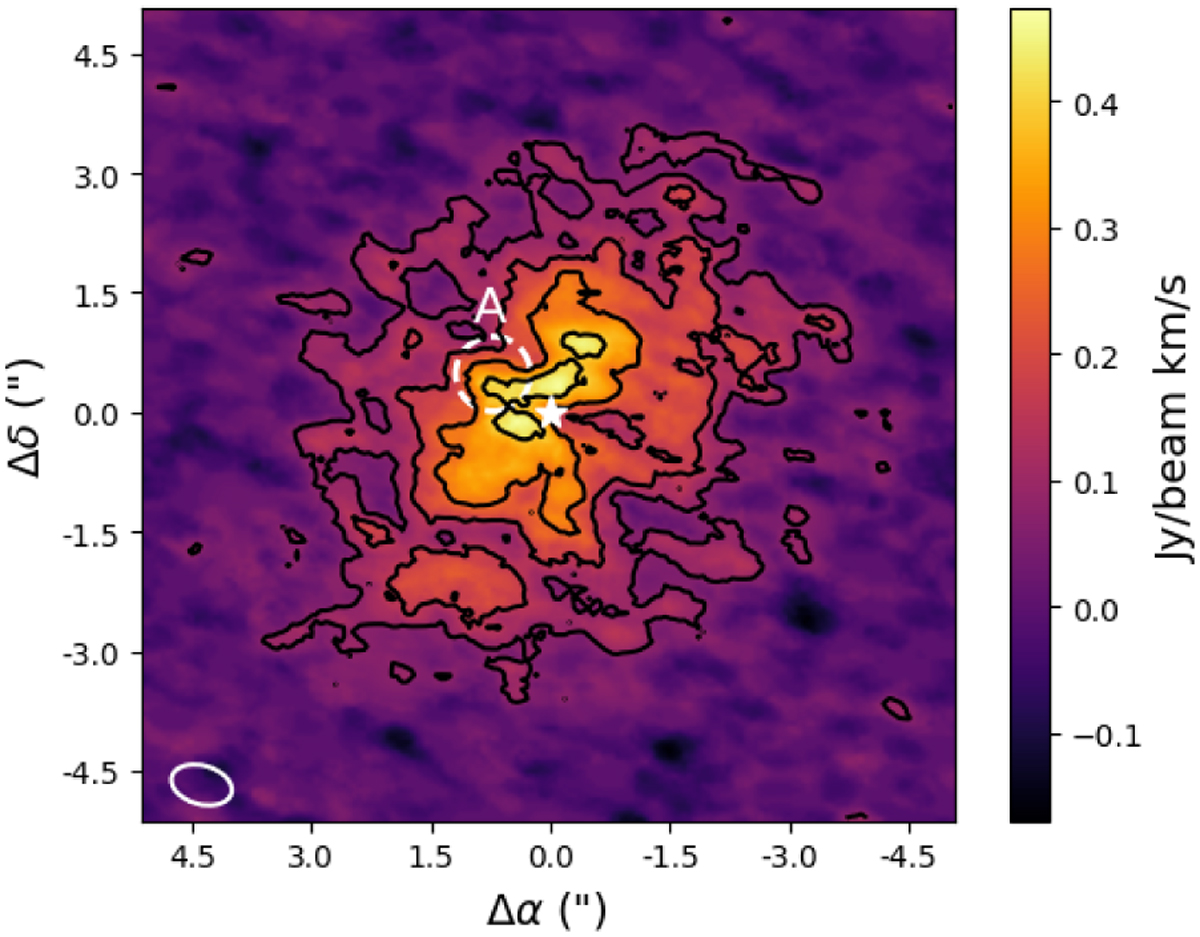
HD 163296 ALMA band 8 zeroth moment map of [CI] line emission. The bottom left white ellipse shows the synthesized beam FWHM. The star position is indicated at (0, 0) by a white figure. Contours show 3σ, 6σ, 10σ, and 15σ (1σ = 2.63 × 10⁻² Jybeam−1 km s−1). Only the emission within the velocity range from 1.3 to 10.6 km s−1 and pixels with values higher than 2σ were used. The enclosed region, labeled by the letter A, highlights the position of an asymmetry feature detected in the channel maps (see Fig. A.1).
Current usage metrics show cumulative count of Article Views (full-text article views including HTML views, PDF and ePub downloads, according to the available data) and Abstracts Views on Vision4Press platform.
Data correspond to usage on the plateform after 2015. The current usage metrics is available 48-96 hours after online publication and is updated daily on week days.
Initial download of the metrics may take a while.