Fig. 6
Download original image
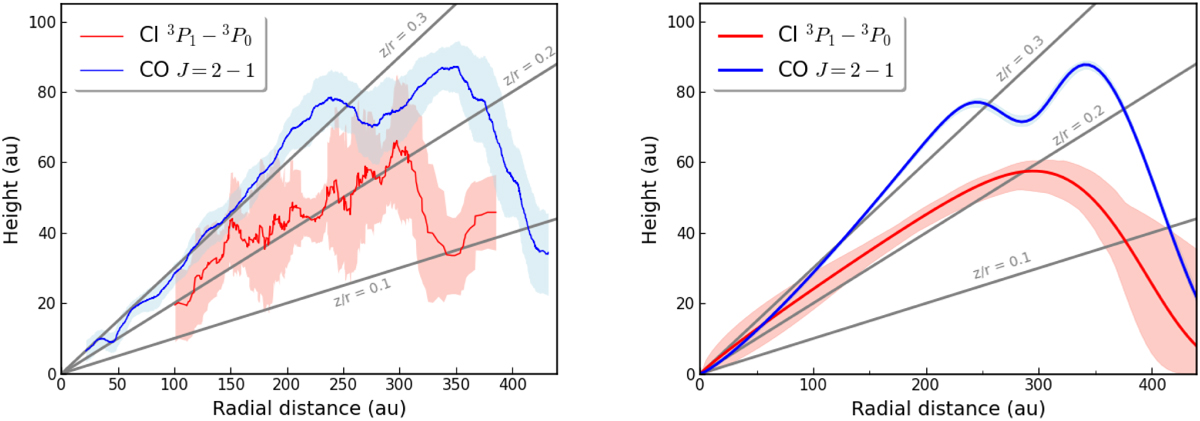
Left: average surface emission height plotted against deprojected radial distance from the star of both CO and [CI] obtained with disksurf. The shaded region shows 1σ scatter of the original obtained points shown in Fig. B.3. Right: best fitted model for [CI] and CO surface emission. For the first, a simple exponentially tapered power law function (as is described in Eq. (3)) was used; meanwhile, for CO, a double exponentially tapered power law function is considered to get a better modeling of its double-peaked shape. The shaded region was obtained by sampling the posterior distribution of the parameters.
Current usage metrics show cumulative count of Article Views (full-text article views including HTML views, PDF and ePub downloads, according to the available data) and Abstracts Views on Vision4Press platform.
Data correspond to usage on the plateform after 2015. The current usage metrics is available 48-96 hours after online publication and is updated daily on week days.
Initial download of the metrics may take a while.