Fig. A.1
Download original image
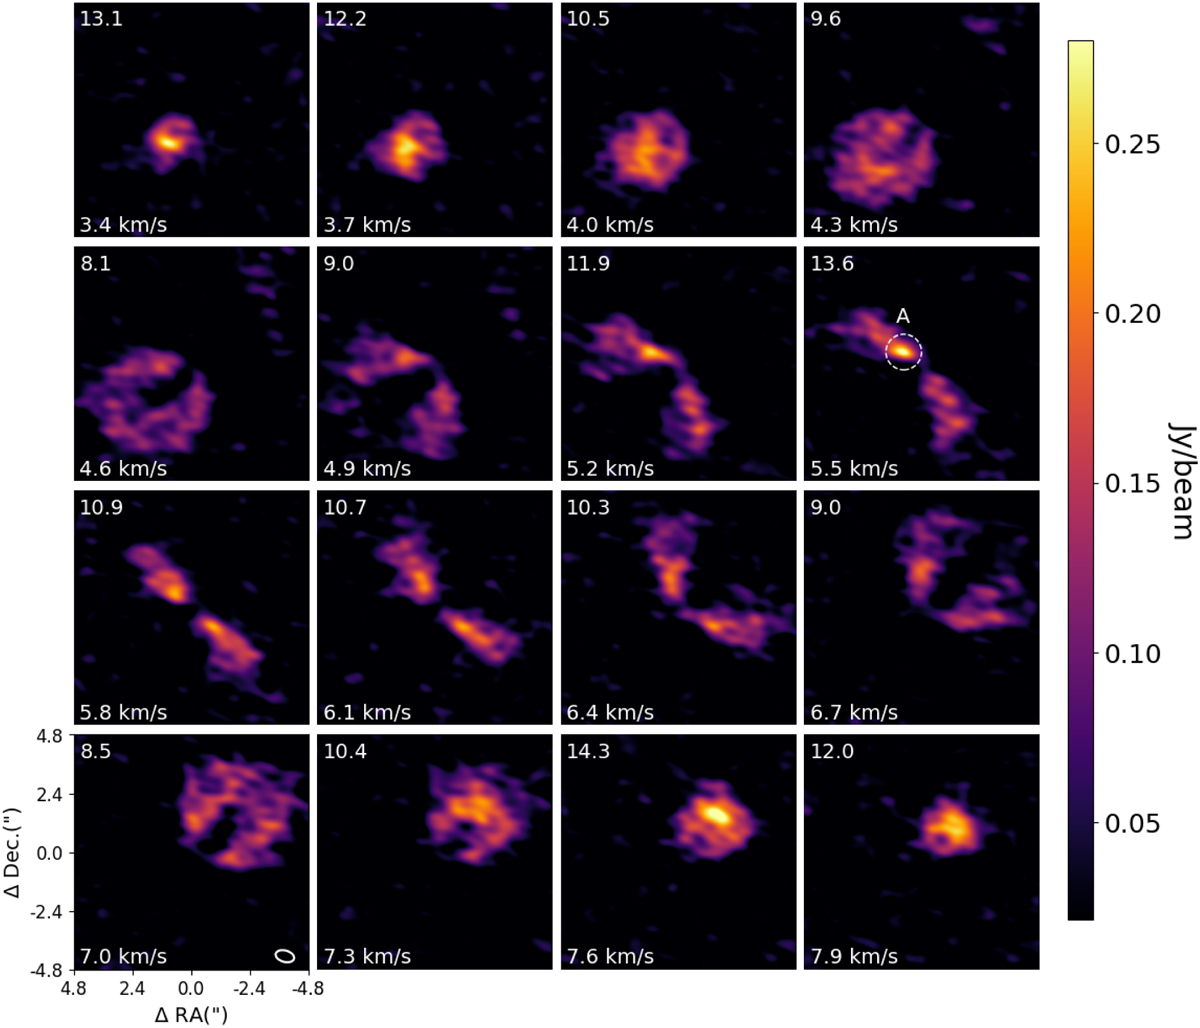
[CI] = 3P1 − 3P0 line emission channel maps observed in HD163296. Each panel has dimensions of 9.64” × 9.64” and, at the bottom left, is labeled by its velocity relative to the rest frequency of the [CI] line. At the top left, the peak S/N is shown. The panel of 7.0 km s−1 shows the synthesized beam FWHM with a white ellipse. The enclosed region in the panel of 5.5 km s−1, labeled by the letter A, highlights an asymmetry feature in the emission.
Current usage metrics show cumulative count of Article Views (full-text article views including HTML views, PDF and ePub downloads, according to the available data) and Abstracts Views on Vision4Press platform.
Data correspond to usage on the plateform after 2015. The current usage metrics is available 48-96 hours after online publication and is updated daily on week days.
Initial download of the metrics may take a while.