Fig. B.3
Download original image
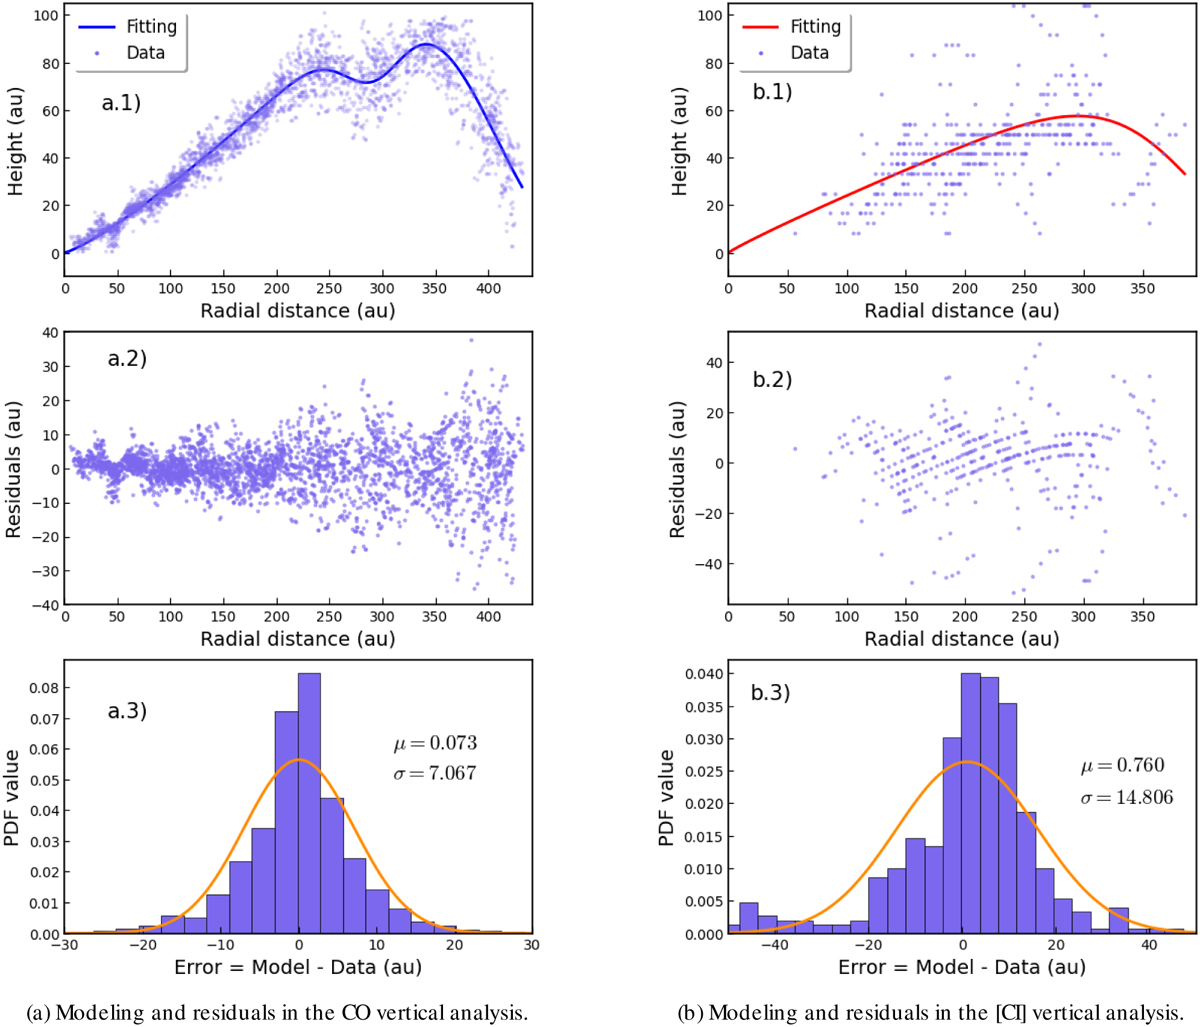
(a.1, b.1): Purple data points show the surface height obtained with disksurf, applied to the data presented in 2. Solid blue and red lines show the best-fitted model for CO and [CI], respectively. (a.2, b.2): Residuals as a function of radial distance. (a.3, b.3): Normalized histogram of the residuals. The solid orange line shows a normal distribution with mean and standard deviations measured from residuals.
Current usage metrics show cumulative count of Article Views (full-text article views including HTML views, PDF and ePub downloads, according to the available data) and Abstracts Views on Vision4Press platform.
Data correspond to usage on the plateform after 2015. The current usage metrics is available 48-96 hours after online publication and is updated daily on week days.
Initial download of the metrics may take a while.