Open Access
Fig. 3
Download original image
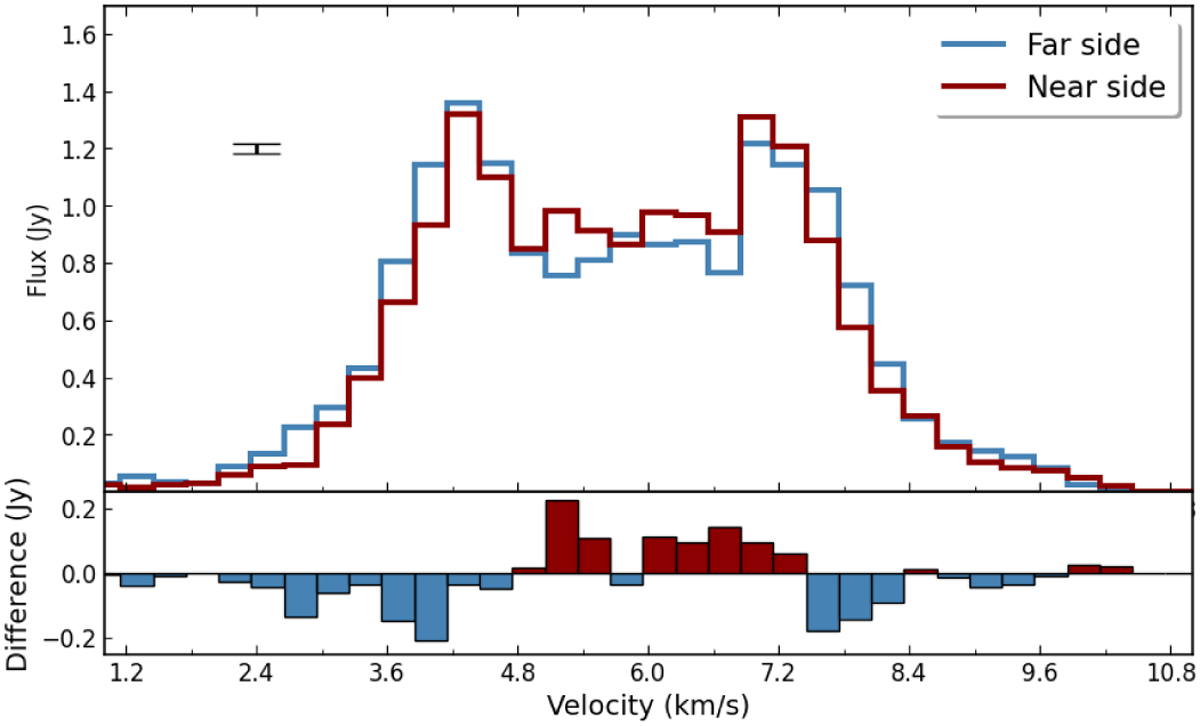
Extracted spectrum from the near and far sides of the disk from the channel maps shown in Fig. A.1. A flux excess coming from the near side of the disk is observed from 5.2 to 7.3 km s−1. The top left black bar shows an estimate of the propagated error in both spectra.
Current usage metrics show cumulative count of Article Views (full-text article views including HTML views, PDF and ePub downloads, according to the available data) and Abstracts Views on Vision4Press platform.
Data correspond to usage on the plateform after 2015. The current usage metrics is available 48-96 hours after online publication and is updated daily on week days.
Initial download of the metrics may take a while.