| Issue |
A&A
Volume 671, March 2023
|
|
|---|---|---|
| Article Number | A167 | |
| Number of page(s) | 21 | |
| Section | Interstellar and circumstellar matter | |
| DOI | https://doi.org/10.1051/0004-6361/202244865 | |
| Published online | 23 March 2023 | |
Physical conditions for dust grain alignment in Class 0 protostellar cores
I. Observations of dust polarization and molecular irradiation tracers
1
Laboratoire AIM, Paris-Saclay, CEA/IRFU/SAp – CNRS – Université Paris Diderot,
91191
Gif-sur-Yvette Cedex,
France
2
SOFIA Science Center, Universities Space Research Association, NASA Ames Research Center,
Moffett Field,
California
94035,
USA
e-mail: valentin.j.legouellec@nasa.gov
3
European Southern Observatory,
Alonso de Córdova 3107, Vitacura, Casilla
19001,
Santiago,
Chile
4
Harvard-Smithsonian Center for Astrophysics,
Cambridge, MA
02138,
USA
5
National Astronomical Observatory of Japan, NAOJ Chile,
Alonso de Córdova 3788, Office 61B,
7630422
Vitacura, Santiago,
Chile
6
Joint ALMA Observatory,
Alonso de Córdova 3107,
Vitacura, Santiago,
Chile
Received:
1
September
2022
Accepted:
18
November
2022
Context. High angular resolution observations of Class 0 protostars have produced detailed maps of the polarized dust emission in the envelopes of these young embedded objects. Interestingly, the improved sensitivity brought by ALMA has revealed wide dynamic ranges of polarization fractions, with specific locations harboring surprisingly large amounts of polarized dust emission.
Aims. Our aim is to characterize the grain alignment conditions and dust properties responsible for the observed polarized dust emission in the inner envelopes (≤1000 au) of Class 0 protostars.
Methods. We analyzed the polarized dust emission maps obtained with ALMA and compared them to molecular line emission maps of specific molecular tracers, mainly C2H, which allowed us to probe one of the key components in dust grain alignment theories: the irradiation field.
Results. We show that C2H peaks toward outflow cavity walls, where the polarized dust emission is also enhanced. Our analysis provides a tentative correlation between the morphology of the polarized intensity and C2H emission, suggesting that the radiation field impinging on the cavity walls favors both the grain alignment and the warm carbon chain chemistry in these regions. We propose that shocks happening along outflow cavity walls could potentially represent an additional source of photons contributing to dust grain alignment. However, some parts of the cores, such as the equatorial planes, exhibit enhanced polarized flux, although no radiation driven chemistry is observed, for example where radiative torques are theoretically not efficient enough. This suggests that additional physical conditions, such as source geometry and dust grain evolution, may play a role in grain alignment.
Conclusions. Comparing chemical processes with grain alignment physics opens a promising avenue to develop our understanding of the dust grain evolution (i.e., their origin, growth, and structure) in the interior of Class 0 protostars. The source geometry and evolution can represent important factors that set the environmental conditions of the inner envelope, determining whether the radiation field strength and spectrum can drive efficient dust grain alignment via radiative torques.
Key words: ISM: jets and outflows / ISM: magnetic fields / polarization / stars: formation / stars: protostars / radiation mechanisms: thermal
© The Authors 2023
 Open Access article, published by EDP Sciences, under the terms of the Creative Commons Attribution License (https://creativecommons.org/licenses/by/4.0), which permits unrestricted use, distribution, and reproduction in any medium, provided the original work is properly cited.
This article is published in open access under the Subscribe to Open model. Subscribe to A&A to support open access publication.
1 Introduction
Located in the densest parts of molecular clouds, Class 0 protostars are the youngest low-mass star forming objects (Andre et al. 1993; Andre & Montmerle 1994). They are composed of a growing protostellar embryo at the center, which accretes material from the surrounding cold protostellar envelope. These objects have yet to accrete the main part of their future main sequence star mass as most of their mass is still located in the envelope, such that Lsub-mm/Lbol ≫ 0.5% and Menv ≫ M*. The Class 0 protostellar phase thus corresponds to a period of vigorous accretion activity whose physical characteristics will set the properties of the future star and protoplanetary disk. At this stage the accretion is ruled by a variety of physical processes, and it remains unclear if, for example, the accretion is disk-regulated, as it is in later stage T Tauri stars (Hartmann et al. 2016), or if it occurs directly from the infalling flows of the envelope (Lee et al. 2021). The accretion is responsible for the vigorous ejection of material in the form of (bi)polar jets (Bachiller & Tafalla 1999; Arce et al. 2007; Bally 2016), and for an important irradiation feedback on the envelope caused by the accretion shock onto the central protostellar embryo (Spaans et al. 1995). Outflow cavities surrounding the jets are also formed, potentially powered by the collimated jet (Raga & Cabrit 1993) and/or by the ejection of low-velocity winds launched at disk scales (Louvet et al. 2018; de Valon et al. 2020).
Outflow cavities are directly subject to the radiation field emanating from the accretion activity (Krumholz et al. 2012), which may highly influence the chemistry of the inner envelope (Stäuber et al. 2004, 2005). For instance, far-infrared rotational lines of CO and H2O from the bulk of the emission of young protostars (Spaans et al. 1995; Hogerheijde et al. 1998; van Kempen et al. 2009a; Kristensen et al. 2013), were reproduced by models accounting for UV-heated gas and/or shocks along outflow cavity walls (Goicoechea et al. 2012; Visser et al. 2012; Lee et al. 2015). The UV photons coming from the accretion disk around the central protostellar embryo, which are reprocessed or are scattered into cavities, are responsible for heating the gas and thus creating photon dominated region (PDR) conditions in outflow cavity walls, which can also be probed by [CI] and [CII] lines; the presence of these lines suggests the presence of UV-irradiated shocks (van Kempen et al. 2009b; Goicoechea et al. 2012; Yıldız et al. 2012). Farther away from the central object, additional UV photons can be produced in bow shocks of the outflow (Böhm et al. 1993), if J-shocks are present (Neufeld & Dalgarno 1989a,b), and/or by small-scale shocks along the walls of the cavities (Curiel et al. 1995; Saucedo et al. 2003; Walter et al. 2003). The presence of irradiating photons was also confirmed by observations along the outflow cavity walls of molecules tracing warm chemistry processes involving UV photons, such as C2H and c-C3H2 (Murillo et al. 2018; Tychoniec et al. 2021), because the formation pathway of these molecules requires a significant amount of UV irradiation. The corresponding chemistry is similar to what is encountered at the edge of PDR zones, for example the Horsehead PDR (Cuadrado et al. 2015; Guzmán et al. 2014, 2015).
On the other hand, recent observations have revealed that outflow cavity walls also seem to harbor specific grain alignment conditions as strong polarized dust emission along the walls of the bipolar outflow cavities were detected (Hull et al. 2017a, 2020; Cox et al. 2018; Maury et al. 2018; Ko et al. 2020; Kwon et al. 2019; Le Gouellec et al. 2019). In regions of optically thin thermal dust emission, which is the case for the typical spatial scales resolved by ALMA toward protostellar envelopes (i.e., ~50–1000 au), the polarization is caused by the thermal emission of aligned and aspherical dust grains. In the typical conditions prevailing in protostellar envelopes, the most likely grain alignment process is caused by radiative alignment torques (RATs; Draine & Weingartner 1996, 1997; Lazarian & Hoang 2007; Andersson et al. 2015), which aligns the dust grains’ minor axis parallel to the ambient magnetic field lines. This causes the linear polarization of the dust thermal emission to be orthogonal to the magnetic field component projected on the plane of the sky. The RAT mechanism is subject to the local environmental conditions (i.e., the mean wavelength, strength, and degree of anisotropy of the radiation field), the dust characteristics (size, shape, composition), and the gas temperature and density. Understanding the causes for the strong polarized dust emission detected in outflow cavity walls and within the inner envelope (≤500 au) is thus crucial to further developing the knowledge we have of the impacts that accretion has on what surrounds the central protostellar embryo. Because it governs the gaseous collisional rate that randomizes the orientation of the dust grains, gas density is one of the key parameters that set the grain alignment conditions (see, e.g., Reissl et al. 2020). However, the polarization fraction maps are irregular with non-homogeneous spatial distribution in protostellar envelopes. The high values exhibited in outflow cavity walls may point toward the total intensity not being a good proxy for the local gas volume density and/or specific grain alignment conditions such as favored irradiation. In this work, divided into two papers, we make a joint effort to analyze both the UV-sensitive chemistry and the efficiency of the dust grain alignment in the interiors of Class 0 protostars. This paper focuses on comparing the location of strongly irradiated molecular gas with the spatial distribution of aligned grains in the envelope of Class 0 protostellar cores through tracers of warm chemistry and polarized dust emission. In this first work, which relates to observations alone, we use preferentially the polarized intensity as a proxy for the morphology of the favorable grain alignment conditions to qualitatively address the role of the radiation field. The polarization fraction values taken into account with the levels of magnetic field organization will be discussed in Paper II, which will focus on reproducing the observed grain alignment efficiency via comparisons with radiative transfer modeling, where the role of the radiation field is investigated.
This paper is structured as follows. In Sect. 2 we present ALMA dust polarization observations alongside ALMA molecular line observations of the UV-sensitive C2H molecule and the shock-tracer SO in a sample of Class 0 protostars. In Sect. 3 the spatial distribution of polarized dust emission is qualitatively compared with the distributions of the molecular emission lines. Finally, in Sect. 4 we discuss the comparisons between the dust polarization and irradiation tracer observational results. We draw our conclusions in Sect. 5.
2 ALMA observations of the polarized dust emission and molecular gas tracers
We collected and analyzed observations of six Class 0 protostars carried out with the ALMA interferometer: B335, L1448 IRS2, NGC1333 IRAS4A1 & IRAS4A2, Serpens Emb 8, Serpens Emb 8(N). We present in Figs. 1–5 the maps of the dust continuum emission, the polarized dust emission, and the molecular gas emission obtained toward six sources. We use molecular line observations to either trace the bipolar outflow (with the CO(J = 2 → 1) transition), or to probe the irradiation field in the inner core with the C2H and SO molecular species (two other molecules c-C3H2 and CS, potentially tracing the radiation field, are presented in Appendix A as additional material). As introduced above, the C2H molecule has been detected in PDRs, and the role of the irradiation field (enhancing the ionization) in its chemical formation pathway has been well established. In addition, SO is a tracer of shocks, which can be sources of UV photons. We compare the maps of polarized flux with those of moment 0 molecular emission lines to investigate whether the dust polarization is enhanced in highly irradiated zones. The goal is to understand the physical conditions that favor efficient grain alignment. We discuss the chemistry of these molecules in Sect. 4.3.
Details of the sources and dust polarization observations we present can be found in Table 1, while the details of the spectral lines studied can be found in Table 2. These sources were selected because the interferometric maps exhibit extended polarized dust emission throughout the inner envelope (~10–2000 au), and ALMA datasets of the chemical tracers we target were publicly available, offering similar uv-coverage to the dust polarization observations1. The polarized dust emission maps of B335, Serpens Emb 8, and Serpens Emb 8(N) are from Hull et al. (2017b), Le Gouellec et al. (2019, 2020), and details of the data reduction can be found in the corresponding references. For this project we calibrated and imaged the ALMA dust polarization observations toward L1448 IRS2, and NGC 1333 IRAS4A. To produce the polarized dust continuum emission maps we used the tclean task of the CAS A software version 5.8 (McMullin et al. 2007). We applied three to four rounds of consecutive phase-only self-calibration (Brogan et al. 2018), using the total intensity (Stokes I) solutions as the model, with a Briggs weighting parameter of 0.5–1, depending on the source, and the appropriate integration time intervals. The three Stokes parameters I, Q, and U were cleaned separately after the last round of self-calibration, using an appropriate residual threshold and number of iterations. We then created the debiased polarized intensity maps following the method from Wardle & Kronberg (1974) and Hull & Plambeck (2015).
A variety of ALMA 12 m datasets at 1.3 mm were used to target the molecular emission lines of C2H and SO, whose angular resolutions are about 0.3.″–0.8.″. The datasets were pipeline calibrated and manually phase-only self-calibrated2, with the CAS A software version 5.8 (McMullin et al. 2007). The images were made with the tclean task. The images were produced with an adapted mask constructed manually in each channel covering the entire emission. For the outflow traced by the CO molecular line, we pipeline calibrated and manually phase-only self-calibrated ALMA 12 m observations of the CO(J = 2 → 1) transition for L1448 IRS2 and NGC 1333 IRAS4A. The CO molecular line observations are from Cabedo et al. (2021) in B335, Hull et al. (2017b) in Serpens Emb 8, Le Gouellec et al. (2019) and Tychoniec et al. (2019) in Serpens Emb 8(N), and Tobin et al. (2018) in L1448 IRS2.
B335. Figure 1 presents the dust polarization observations from Maury et al. (2018) and Maury et al. (in prep.) overlaid with contours following the intensity levels of the integrated emission of the C2H molecular line from Imai et al. (2016). The dataset also includes the SO (NJ = 67 → 56) transition, which we do not show here as the line is only detected at the dust continuum peak. As pointed out in Maury et al. (2018), the polarized dust emission in B335 is bimodal. The polarized flux is either enhanced along the outflow cavity walls with the average magnetic fields orientated east–west following the walls of the cavities or enhanced toward the equatorial plane of the core (the northern patch of polarized dust emission) where the magnetic field orientations are north–south. This bi-modality is also found in the histogram of polarization position (Maury et al. 2018), and is actually present in a few other published observations of Class 0 cores (Le Gouellec et al. 2020). The emission of the carbon chain molecule C2H is clearly enhanced toward the outflow cavities. C2H emission appears across the bulk of the bipolar cavity traced by the CO emission, with enhancement along the cavity walls, up to ~1500 au for the southern edges. The polarized flux and these molecular emission lines thus appear to spatially overlap toward the outflow cavity walls. However, the equatorial plane to the north of the dust continuum peak, which is strongly polarized, seems to be devoid of molecular line emission tracing irradiated conditions, suggesting a different nature of the irradiation conditions in the mid-plane, compared to the outflow cavity walls. This applies only to the northern part of the core, as the southern part is much less polarized.
L1448 IRS2. Figure 2 presents the dust polarization observations from (Kwon et al. 2019) overlaid with contours following the intensity levels of the integrated emission of the C2H molecular line from Y. Zhang et al. (in prep.; ALMA project 2016.1.01501.S, PI: N. Sakai). The dataset also includes the SO (NJ = 67 → 56) and SO (NJ = 66 → 55) transitions, which we do not show here as the emission only peaks at the dust continuum peak. The polarized dust emission is enhanced on each side of blue- and redshifted outflow, embracing the cavities. The magnetic field lines exhibit a very pinched hourglass-like morphology. The depolarization in the mid-plane is likely due to beam smearing effects. The C2H molecular emission line appears enhanced toward the walls of the cavities, as is the case for the polarized dust emission.
NGC1333 IRAS4A. Figure 3 presents the dust polarization observations from Ko et al. (2020) overlaid with contours following the intensity levels of the integrated emission of the C2H and SO molecular lines from Chuang et al. (2021). Similarly to the SMA dust polarization of this wide binary (Girart et al. 2006), the magnetic field global morphology exhibits a pinched hourglass-like morphology aligned with the direction of the bipolar outflows. The maps shown here, however, suggest that the polarized emission is enhanced along the outflow cavities of both protostars IRAS4A1 (southeast) and IRAS4A2 (northwest) as well as the infalling equatorial planes. The SO molecular line peaks toward the blue- and redshifted outflow of IRAS4A2, and only in the blueshifted lobe of the IRAS4A1 outflow. In such a bright Class 0 object, where dust polarization is strong and extended across the inner ~2000 au of the core, C2H emission is surprisingly not extended compared to the first two objects we described. The C2H molecular emission line is mostly associated with two compact emission features in the outflow of IRAS4A2, and a weak ~5σ detection toward the eastern wall of the IRAS4A1 redshifted cavity. The lower S/N emission shown in Chuang et al. (2021) exhibits a more extended emitting region, consistent with the outflow cavity.
Serpens Emb 8. Figure 4 presents the dust polarization observations from Hull et al. (2017a) overlaid with contours following the intensity levels of the integrated emission of the C2H and SO molecular lines from van Gelder et al. (2020). In this core the scenario seems to be surprising, given the drastic difference between the extent of the C2H emission with respect to the polarized dust emission. The C2H emission extends much farther than the polarized dust emission in the central regions of the envelope. Where it overlaps with the polarized dust emission, the C2H emission morphology seems to show a morphology following closely that of the polarized intensity, especially to the southeast of the core. At the base of the cavity walls of the blueshifted outflow, the C2H emission is also enhanced and exhibits a V-shaped pattern, confirming that the cavity walls are the ideal conditions to form and/or excite the rotational transitions of C2H. The SO and C2H peaks are also ~2000 au away from the center, toward the cavity of the blueshifted outflow in the northwest, where faint dust emission is also detected. The surprising morphology of the C2H emission in this source, which is more extended than the emission in the other protostars analyzed here, could be explained by the recent accretion activity of this source. With near-infrared spectroscopy, Greene et al. (2018) showed that the properties of the central protostellar embryo (i.e., low surface gravity and effective temperature) suggest that Serpens Emb 8 has recently undergone a period of high accretion activity, which may explain the spatial extent of the irradiation-sensitive chemistry in the core. The emission from the SO line exhibits an elongated structure toward the center of the core that overlaps with one patch of polarized dust emission. Finally, SO also peaks on the southern side of the redshifted outflow lobe.
Serpens Emb 8(N). Figure 5 presents the dust polarization observations from Le Gouellec et al. (2019) overlaid with contours following the intensity levels of the integrated emission of the C2H and SO molecular lines from Le Gouellec et al. (2019) and Tychoniec et al. (in prep.). C2H peaks in the outflow cavities, with an asymmetry in the emission strength (it is stronger on the redshifted side); it is slightly spatially shifted from the polarized dust emission. On the redshifted side C2H peaks farther away than the polarized dust emission, and on the blueshifted side C2H peaks inside the cavity, while the polarized dust emission is enhanced toward the walls of the cavity. The disorganization of the structures in dust and polarized dust emission of Serpens Emb 8, relative to Serpens Emb 8(N), which is much more symmetric and organized, suggests that irradiation may have escaped more easily throughout the inner core in Emb 8. This would explain why the C2H emission is so different between the two sources: it only peaks in the walls of the cavity in Emb 8(N) versus everywhere in the inner envelope and in the blueshifted outflow lobe in Emb 8. In Serpens Emb 8(N), the SO molecular emission line peaks toward the walls of the blueshifted cavity, from the center of the source up to ~2000 au. It also peaks in the redshifted cavity, but much farther away, at ~2000 au from the source, likely spotting the bow shock studied in Tychoniec et al. (2019). Toward the northern wall of the blueshifted cavity, the SO emission coincides with a patch of highly polarized dust emission.
In summary, the carbon chain molecule C2H seems preferentially associated with outflows and cavity walls in some sources, and is widely distributed in others. Such different spatial segregation may suggest that the source geometry plays an important role in the heating of the inner envelope (see Sect. 4.1). Another spatial segregation among various irradiation conditions is also suggested by the emission line spectra in IRAS4A, Serpens Emb 8, and Serpens Emb 8(N) shown in Fig. 6. In these four spectra, while the velocity of the C2H associated hyperfine structure is distributed around the systemic velocity of the source, SO exhibits a much broader range of gas velocities. This indicates to what extent the molecular species we target belong to the outflow (or the material entrained by the outflow), like SO, or if it belongs to the envelope–cavity walls, like C2H. In addition, the spectra of CS is distributed toward a broader range of gas velocities than the C2H spectra, but narrower compared to the SO spectra (see Appendix A for the moment 0 maps of CS). Hence, while C2H seems to trace the irradiated walls of the cavity, located between the outflowing gas of the outflow and the infalling gas from the envelope, SO seems to be linked with the outflowing gas, and as a shock tracer its emission emanates from the interaction zone between cavity walls and the jet–outflow system.
These molecular lines are expected to trace the regions with abundant UV photons in the gas. We thus investigate whether the polarized dust emission presents different properties in these areas, which would allow us to characterize the role played by such energetic photons in the mechanisms producing the polarized dust emission. However, significant dust polarization signals are observed toward locations that are likely not under a strong radiation field, for example in equatorial mid-planes and envelope emission in the north of B335 and mid-planes of IRAS4A. Therefore, the local physical conditions need to be further explored in order to understand how dust grain alignment is efficient in this kind of environment. This is addressed with the help of radiation transfer calculations presented in Paper II.
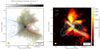 |
Fig. 1 Observations of magnetic fields, polarized intensity, and molecular lines around the B335 Class 0 protostellar core. Left panel: line segments represent magnetic field lines, rotated by 90° from the dust polarization angle (the length of a segment does not represent a quantity). They are plotted where the polarized intensity P > 3σP. The gray scale is the total intensity (Stokes I) of the thermal dust emission, shown from 3σI. The white contours trace the total intensity at levels of 5, 8, 11, 16, 24, 44, 74, 128, 256 × σI. The blue and red contours trace the moment 0 map of the blueshifted (by integrating emission from −25 to 7 km s−1) and redshifted (by integrating emission from 10 to 35 km s−1) CO (J = 2 → 1) map at levels of 3, 5, 7, 9, 11, 16, 24, 44, 74, 128, 256, 400 × the rms noise level of the map. Right panel: in each panel the color scale is the dust polarization intensity, shown from 3σP. The crosses indicate the peak of the dust continuum map. The thin gray contours trace the dust polarization intensity, at levels of 3, 5, 7, 9, 11, 16, 24, 44 × σP. The thick light blue contours trace the moment 0 map of the C2H (by integrating emission from 7 to 12.5 km s−1) molecular emission spectral line (see Table 2 for details of the line transitions) at levels of 3, 5, 7, 9, 11, 16, 24, 44 × the rms noise level of each map. In the bottom left corner of each panel the ellipses represent the beam resolution element of a given dataset: yellow for polarized dust emission, red for CO bipolar outflow emission, and white for the CCH spectral emission line. The ALMA 1.3mm dust polarized emission is from Maury et al. (2018, and in prep.). The ALMA CO (J = 2 → 1) bipolar outflow emission is from Cabedo et al. (2021). The C2H emission line is from Imai et al. (2016). |
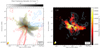 |
Fig. 2 Same as Fig. 1, but for the L1448 IRS2 Class 0 protostellar core. The blue and red contours trace the moment 0 map of the blueshifted (by integrating emission from −16.5 to 3 km s−1) and redshifted (by integrating emission from 6 to 21.5 km s−1). The thick light blue contours (right panel) trace the moment 0 map of the C2H (by integrating emission from 3 to 8 km s−1) molecular emission spectral line. The ALMA 1.3 mm dust polarized emission is from Kwon et al. (2019). The ALMA CO (J = 2 → 1) bipolar outflow emission is from Tobin et al. (2018). The C2H emission line is from ALMA project 2016.1.01501.S, Y. Zhang (in prep.). |
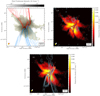 |
Fig. 3 Same as Fig. 1, but for the NC1333 IRAS4A Class 0 protostellar core. The blue and red contours trace the moment 0 map of the blueshifted (by integrating emission from −30 to 4 km s−1) and redshifted (by integrating emission from 10 to 55.5 km s−1). The thick light blue contours (top right and bottom panels) trace the moment 0 map of the C2H (by integrating emission from 2.5 to 15.5 km s−1) and SO (by integrating emission from −10 to 19.5 km s−1) molecular emission spectral line. The two crosses are located at the two peaks of the dust continuum map. IRAS4A1 is to the southeast of IRAS4A2. The ALMA 1.3mm dust polarized emission is from Ko et al. (2020). The ALMA CO(J = 2 → 1) bipolar outflow emission is from T.C. Ching 2016.1.01089.S. The SO emission is line from Chuang et al. (2021). |
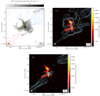 |
Fig. 4 Same as Fig. 1, but for the Serpens Emb 8 Class 0 protostellar core. The blue and red contours trace the moment 0 map of the blueshifted (by integrating emission from −10 to 6.5 km s−1) and redshifted (by integrating emission from 10 to 21 km s−1). The thick light blue contours (top right and bottom panels) trace the moment 0 map of the C2H (by integrating emission from 4.4 to 12.6 km s−1) and SO (by integrating emission from −1.5 to 15.5 km s−1) molecular emission spectral line. ALMA band 0.87mm dust polarized emission is from Hull et al. (2017a). ALMA CO (J = 2 → 1) bipolar outflow emission is from Le Gouellec et al. (2019). C2H and SO emission line is from van Gelder et al. (2020) and Tychoniec et al. (2021). |
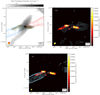 |
Fig. 5 Same as Fig. 1, but for the Serpens Emb 8(N) Class 0 protostellar core. The blue and red contours trace the moment 0 map of the blueshifted (by integrating emission from −10 to 6.5 km s−1) and redshifted (by integrating emission from 10 to 21 km s−1). The thick light blue contours (top right and bottom panels) trace the moment 0 map of the C2H (by integrating emission from 5.4 to 12.8 km s−1) and SO (by integrating emission from −16 to 8 km s−1, and from 10.5 to 35.5 km s−1) molecular emission spectral line. The ALMA band 0.87mm dust polarized emission, ALMA CO (J = 2 → 1) bipolar outflow emission, and C2H emission line are from Le Gouellec et al. (2019). The SO emission line is from ALMA project 2019.1.00931.S, Tychoniec et al. (in prep.). |
Sources and ALMA dust polarization observations details.
ALMA molecular line observations details.
3 Comparing the spatial distribution of the emissions maps
We present a quantitative comparison between the spatial distribution of the UV-sensitive tracer C2H and that of the polarized dust emission. A simple flux to flux comparison did not appear to be the most relevant method to compare the morphology of the moment 0 of the C2H molecular emission and the polarized intensity P. We chose to use two-sided Kolmorogov-Smirnov (KS) tests between these two maps. Only B335 and L1448 IRS2 have high enough sensitivity in both the C2H and P maps for the emissions to overlap sufficiently, the main condition to run the KS tests. Therefore, we performed the tests only on these two sources. In order to match the spatial frequency of emission, both datasets were reduced again using a common uv-range. The C2H moment 0 and P maps were then smoothed to the same angular resolution, and regridded to a Nyquist pattern (4 pixels per beam surface area).
We now describe the method used to characterize the morphology of the emission in both maps. We follow the propagation path of photons emanating from the central region, and investigate whether a common cause (i.e., the irradiation field) can be responsible for both the emission of UV-sensitive molecules and the polarized dust emission. To do so, we draw a number N of lines starting from the peak of the total intensity map and going up to the outer edge of the maps over 360° to obtain a set of 1D emission profiles along those N lines. Among the profiles that have a sufficient number of high signal-to-noise (S/N) pixels in both the C2H moment 0 and polarized intensity maps (we require in this selection that at least five pixels have S/N ≥ 3), a 1D Gaussian fit of the profile is attempted. If the 1D Gaussian fits converge in both the C2H moment 0 and P maps, we retain two parameters, the standard deviation σ and the position of the center of the Gaussian µ, for each map. We now have a set of N′ (with N′ ≤ N, given that we selected profiles for S/N and 1D Gaussian fit convergence reasons) couples (σ,µ) for both the C2H moment 0 and P maps.
Before computing the KS tests, we draw sets of perturbations (i.e., adding dispersion in the values) from a Gaussian distribution of a given width Σ on these (σi,µi)i∈⟦i,…,N′⟧, (σi)i∈⟦i,…,N′⟧, and (μi)i∈⟦i,…,N′⟧ distributions obtained with the P map3. We then perform two-sided 2D KS tests between ![$\left\{ {{{\left( {{\sigma _i},{\mu _i}} \right)}_{i \in \left[\kern-0.15em\left[ {i,..,N'} \right]\kern-0.15em\right]}}} \right\}{{\rm{C}}_{\rm{2}}}{\rm{H}}$](/articles/aa/full_html/2023/03/aa44865-22/aa44865-22-eq1.png) and {(σi‚ μi)i∈⟦i,…,N′⟧ + T(Σ)}P, where T(Σ) is a Gaussian distribution of width Σ. We also perform two-sided 1D KS tests between
and {(σi‚ μi)i∈⟦i,…,N′⟧ + T(Σ)}P, where T(Σ) is a Gaussian distribution of width Σ. We also perform two-sided 1D KS tests between ![$\left\{ {{{\left( {{\mu _i}} \right)}_{i \in \left[\kern-0.15em\left[ {i,..,N'} \right]\kern-0.15em\right]}}} \right\}{{\rm{C}}_{\rm{2}}}{\rm{H}}$](/articles/aa/full_html/2023/03/aa44865-22/aa44865-22-eq2.png) and {(μi)i∈⟦i,…,N′⟧ + T(Σ)}P, and between
and {(μi)i∈⟦i,…,N′⟧ + T(Σ)}P, and between ![$\left\{ {{{\left( {{\sigma _i}} \right)}_{i \in \left[\kern-0.15em\left[ {i,..,N'} \right]\kern-0.15em\right]}}} \right\}{{\rm{C}}_{\rm{2}}}{\rm{H}}$](/articles/aa/full_html/2023/03/aa44865-22/aa44865-22-eq3.png) and {(σi)i∈⟦i,…,N′⟧ + T(Σ)}P. For each value of Σ (tested in the range 0–4″) we repeat this process n times.
and {(σi)i∈⟦i,…,N′⟧ + T(Σ)}P. For each value of Σ (tested in the range 0–4″) we repeat this process n times.
To evaluate if they are drawn from a common parent distribution, KS tests are performed with these distributions. Each test results in a value p, with low values corresponding to different distributions. We reject the hypothesis that two distributions are drawn from the same parent distribution when p < 0.2 (Peacock 1983; Fasano & Franceschini 1987; Press et al. 2007). At a given Σ we evaluate the distributions of the n p-values obtained (i.e., we derive the mean p-value and the standard deviation).
Figure 7 presents the results of these 1D and 2D KS tests toward B335 (see Appendix B for the tests performed on L1448 IRS2), with N = 100, n = 1000. The N′ S/N selected profiles and corresponding Gaussian fits from the C2H moment 0 and P maps are shown in Fig. B.1. In the top left and top middle panels of Fig. 7, the P and C2H moment 0 maps are overlaid with the N profiles respectively, where the white lines represents the N′ sample of selected profiles (the red lines correspond to the profiles where the S/N selection criteria was not reached, and black lines correspond to the directions where the 1D Gaussian fit does not converge). The top right panel shows the obtained (σ,µ) sample in the form of a 2D diagram. The middle and bottom rows show the results of the 2D and 1D KS tests, respectively. Given our p rejection criteria of 0.2, our 2D KS tests performed on B3335 suggest that the two distributions of  and (σi,µi)P may be drawn from the common parent distribution when we consider dispersion values of Σ ≲ 1.4″ and Σ ≲ 1.8″, applied on the σ and µ distributions, respectively (see the blue contour in the central panel of Fig. 7). For L1448 IRS2, the same conclusion can be made for Σ ≲ 1″ and Σ ≲ 1.2″, applied on the σ and µ distributions, respectively (see Fig. B.2). The selected N′ lines, 38 lines in B335 and 43 lines in L1448 IRS2, lie mostly toward the outflow cavity walls of the two protostars, and cover most of the regions where both emission (polarized intensity and C2H moment 0 maps) are sufficiently high. Therefore, we propose that the spatial distribution of the dust polarization and C2H molecular emission maps can have a common origin, assuming that our approach describes the morphology of these emissions sufficiently well.
In order to investigate the role of the irradiation field in the observed chemistry and the efficiency of the grain alignment, we would need to build models simulating the involved physical and chemical processes. While we perform the modeling of conditions leading to dust grains to align with different efficiencies in Paper II, the modeling of the effect of irradiation on the chemistry is beyond the scope of this work and is left for a future study. We restrict ourselves here to this quantitative comparison, which suggests that the morphology of the P and C2H moment 0 emission maps, are comparable in B335 and L1448-IRS2.
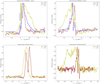 |
Fig. 6 Spectra of molecular emission lines in NGC1333 IRAS4A2, Serpens Emb8, and Serpens Emb 8N. The solid lines show the spectra of the C2H, CS, and SO molecular emission lines, toward the north (top left panel) and the south (top right panel) of IRAS4A2. The spectra of the C2H and SO molecular emission lines toward the redshifted cavity of Serpens Emb 8, and the blueshifted cavity of Serpens Emb 8(N), are shown in the bottom left and bottom right panel, respectively. For IRAS4A, the emission is summed over a circle of 2.5.″ in diameter, centered on the two peaks of C2H visible in the integrated moment 0 map seen in Fig. 3. For Serpens Emb 8 and Serpens Emb 8(N), the spectra are from a circle of 1.″ in diameter located at 800 au from the center, in the redshifted and blueshifted cavity, respectively. In all cases, while the C2H hyperfine structure is detected at the υlsr, the spectra of CS and SO are clearly broader, suggesting material linked to the outflowing gas. |
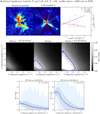 |
Fig. 7 Results from the two-sided 1D and 2D KS tests between the P and C2H moment 0 maps of B335, performed with N = 100 and n = 1000. Top row (left and middle): P and C2H moment 0 emission maps in color scale, respectively. Both maps are overlaid with the N lines, where the white lines correspond to the N′ sample of selected profiles. The red lines correspond to the profiles where the S/N selection criteria was not reached, and the black lines correspond to the profiles where the 1D Gaussian fit does not converge. Right: obtained (σ,µ) values from these 1D Gaussian fits in the form of a 2D diagram, with a linear regression line fitting both the σ and µ values. Middle row: results of the two-sided 2D KS tests, where each pixel corresponds to a given Gaussian distribution of width Σ, added on the sample of σ values (x-axis) and µ values (y-axis), obtained from the P map. The gray scale corresponds to the p-values obtained after n realizations. The left, middle, and right panels, show the mean p-value minus the standard deviation of p-values, the mean p-value, and the mean p-value plus the standard deviation of the obtained p-values, respectively. The blue contours correspond to p = 0.2. Bottom row: results of the two-sided 1D KS tests performed on the µ values (left panel) and on the σ values (right panel). In each panel the solid line and markers represent the resulting mean p-value as a function of Σ, which is the width of the Gaussian distribution added on the σ and µ values obtained from the P map. At each point, the shaded area shows the complete range of obtained p-values, while the error bars indicate the standard deviation of the distribution of p-values after n tries. Given our p rejection criteria of 0.2, we can infer that the two (σ,µ) distributions between the C2H moment 0 and P maps could come from a common parent distribution. |
4 Discussion
4.1 Dust grain polarization and tracers of irradiated molecular gas
The spatial distribution of the polarized dust emission and C2H molecular emission suggests that the heating occurs preferentially along the outflow cavities. The accretion activity onto the central protostellar embryo likely represents the major source of photons responsible for triggering the observed warm carbon chain chemistry (Sakai et al. 2009; Sakai & Yamamoto 2013) and for increasing the grain alignment efficiency by extending the population of dust grains subject to alignment by the radiative torques (Le Gouellec et al. 2020). These processes can explain the highly polarized dust emission and C2H molecular emission observed toward the dense walls of outflow cavities, as suggested by our statistical tests described in Sect. 3. However, we note that this analyzis relies on two sources, and other Class 0s presented in Sect. 2 may show different behaviors.
Several reasons can justify why, in some regions of Class 0s protostellar envelopes, the spatial distribution of the irradiation tracers and polarized dust emission appears to differ. The morphology of the inner envelope density structures directly dictates the propagation scheme of energetic photons emanating from the central source. For example, Serpens Emb 8 and Serpens Emb 8(N) exhibit drastic morphological differences in the ALMA dust continuum and polarized dust emission (Hull et al. 2017b; Le Gouellec et al. 2019). Serpens Emb 8(N) appears much more axisymmetric than Serpens Emb 8, which can significantly affect the map of the radiation field in the inner core. The disorganized structures of Serpens Emb 8 could thus favor the propagation of the radiation field throughout the entire inner envelope rather than along outflow cavities, which appear preferentially polarized in Serpens Emb 8(N). In addition, the various timescales of the physical and chemical processes involved here (i.e., grain alignment and warm carbon chain chemistry timescales) may vary from one source to another. For example, the precession timescale of the IRAS4A2 outflow (Chuang et al. 2021) may prevent the warm carbon chain chemistry from developing farther out in the cavities, explaining why the spatial distribution of the C2H molecular emission is limited compared to the polarized dust emission. In Serpens Emb 8 the increase in irradiation due to the recent accretion burst suggested by Greene et al. (2018) can explain why the C2H molecular emission appears so extended and bright. However, the polarized dust emission within the envelope exhibits a sparse distribution and no significant detection down to the detection levels allowed by the sensitivity of the observations. This could be due to either a more disorganized magnetic field along the line of sight (e.g., Valdivia et al. 2022) or to a mean magnetic field orientation closer to the line of sight. Finally, the last element that is crucial while investigating the role of irradiation in the chemistry and grain alignment, is the properties of dust grains. The structure and size distribution of dust grains could vary throughout the envelope, depending on their spatial origin and the radiation field strength, as dust grains can become rotationally disrupted by radiative torques (Hoang et al. 2021). This point is further explored in Sect. 4.3.3 and in our Paper II. For example, this argument could explain why the northern equatorial mid-plane of B335 is so polarized.
4.2 Contribution of shocks to illumination in cavities
Ultraviolet photons can be produced by mechanical processes, such as at bow shocks in outflows and jets or potentially at smaller shocks along the outflow cavity walls. Herschel observations of far-infrared spectral lines of CO and H2O revealed evidence of irradiated shocks located along outflow cavity walls, associated with a hot (≥500 K) gas component (Kristensen et al. 2017a; Karska et al. 2018). Observations of SO (see Sect. 2), a candidate tracer of the shocks developed at the interaction zones between the outflow–jet system and the ambient envelope gas (Lefloch et al. 2005), also suggest the presence of shocks in outflow cavities. These shocks could be an additional source of UV photons (Neufeld & Dalgarno 1989a,b) propagating in the cavities (van Kempen et al. 2009a). SO can also trace the weak accretion shock of the infalling gas onto the circumstellar disk (Sakai et al. 2014b,a; Miura et al. 2017; van Gelder et al. 2021). It originates from reactions of atomic S released from the grains with OH, and from H2S converted to SO with atomic oxygen and OH. The fact that we notice spatial overlap of SO emission with dust polarization in the outflow cavities of IRAS4A, Serpens Emb 8, and Serpens 8(N; see Sect. 2) tends to suggest that the shock activity plays a role in the alignment of dust grains (see, e.g., Hoang & Tram 2019). To quantify the amount of self-irradiation in the candidate shocks, one possibility could be to model the surface geometry of the cavity walls (see a similar work performed for a bow shock in Gustafsson et al. 2010), and to implement self-consistently the shock models that account for self-irradiation (Lehmann et al. 2020).
4.3 Conditions for development of UV-irradiated gas and efficient grain alignment in protostellar envelopes
Le Gouellec et al. (2020) showed that the grain alignment efficiency is high and roughly constant with respect to column density in a prototypical Class 0 protostellar core. However, they could not entirely reproduce it; their radiative transfer calculations show an alignment efficiency that is too low. However, irradiation seems to be an important factor that drives the extent of the regions where grain alignment produces polarized dust emission efficiently (i.e., where the irradiation is high enough to align grains). The wide variety of the observed spatial extent of the molecular emission lines we presented in Sect. 2 can bring additional clues to the nature and morphology of the radiation field in the inner core.
4.3.1 Using UV-sensitive chemistry and its associated radiation field to explain the observed ALMA dust polarization maps
Interactions between UV radiation from shocks in jets and/or outflows and in cavity walls (see above) and the ambient material could cause the growth of regions of PDR-like conditions (Lee et al. 2015). The identification of PDR tracers toward outflow cavity walls suggests that the UV radiation field is significant in these regions. As mentioned above, one of the limitations of our radiative transfer calculations is the fact that the radiative energy derived in each cell only originates from the reprocessing of the radiative energy escaping from the sink. Analyzing the UV-sensitive chemistry of the inner core could allow us to confirm or rule out the radiation field we implement in our models.
The molecule C2H is usually seen in PDRs, for example the Orion Bar (Teyssier et al. 2004; Pety et al. 2005; van der Wiel et al. 2009; Nagy et al. 2015) and the Horsehead Nebula (Cuadrado et al. 2015; Guzmán et al. 2014, 2015), located at the irradiated, and thus warmer, edge of these regions. C2H was also found enhanced in the presence of UV radiation toward molecular clouds (Fuente et al. 1993; Hogerheijde et al. 1995; Jansen et al. 1995). This molecule involves C, C+, and CH+ in its chemical formation pathway, which is maintained in high abundance in the gas phase in the presence of strong UV radiation (Stäuber et al. 2004; Benz et al. 2016). C2H could thus be expected to trace the (UV-irradiated) outflow cavity walls. C2H has been detected in a variety of Class 0/I protostellar cores, especially toward outflow cavity walls (Jørgensen et al. 2013; Oya et al. 2014, 2018; Imai et al. 2016; Higuchi et al. 2018; Okoda et al. 2018, 2020; Bjerkeli et al. 2016a; Zhang et al. 2018; Bergner et al. 2020; Lee et al. 2020; Tychoniec et al. 2021; Ohashi et al. 2022). In particular, Murillo et al. (2018) exhibited the anti-correlation between the cold gas tracer DCO+ (Murillo et al. 2015; Le Gouellec et al. 2019) and the warm irradiated regions traced by C2H (and also c-C3H2) in two Class 0 cores. Finally, due to an increase in atomic C and C+ in the gas phase, C2H is also commonly observed and modeled at the upper layer of protoplanetary disks where UV and X-ray photons from the stellar irradiation field can propagate more easily (Henning et al. 2010; Kastner et al. 2014, 2015, 2018; Bergin et al. 2016; Cleeves et al. 2018, 2021; Bergner et al. 2019; Miotello et al. 2019). Another candidate mechanism to explain the presence of carbon chain molecules in the gas phase is the top-down destruction of polycyclic aromatic hydrocarbons (PAHs) photo-eroded by the radiation field (Teyssier et al. 2004; Pety et al. 2005, 2012; van der Wiel et al. 2009; Guzmán et al. 2015). However, this proposition is challenged by the lack of observational detections of PAHs in protostellar cores (Geers et al. 2009).
The presence of C2H (but also c-C3H2 and CS; see Appendix A) toward the outflow cavities and cavity walls thus suggests that a significant UV radiation field can survive in the inner ~500 au region of Class 0 protostellar cores. Given the average penetration path length of UV photons through the dense cavity walls, these photons are reprocessed quickly. These reprocessed photons can still contribute to the alignment of small grains, as the mean wavelength of the corresponding radiation spectrum is shorter than the longer-wavelength photons responsible for the alignment of dust grains with sizes ≥ 1 µm. The equatorial mid-planes, which presumably do not experience a similar radiation field (the equatorial mid-planes B335 are depleted in C2H emission line for example), would be dense enough to be protected by rotational disruption (depending of the opacity of the inner circumstellar disk; see Paper II), but would require large grains to produce the observed polarized dust emission. The case of Serpens Emb 8 is, however, paradoxical. The C2H emission that peaks all over the inner core could be due to significant leaks of irradiation from the very disorganized envelope. In this source dust grains might be rotationally disrupted along a variety of directions, which, along with the disorganized magnetic field orientations, can explain the undetected dust polarization in a large portion of the dense regions.
Previous chemical studies constrained the irradiated field in Class 0 protostellar cores. On scales of ~1000 au, comparing atomic line fluxes such as [CII] or [OI] with PDR models, Karska et al. (2018) found that for typical low-mass protostars the UV field was ~102 G0 (where G0 is the radiative flux in the range ~90–200 nm), and 103 G0 for protostars in the regime of SMM1, the brightest protostar in Serpens Main with Lbol ≳ 120 (Enoch et al. 2011; Kristensen et al. 2012). Using UV-irradiated shocks models, they found a UV field of 1–10 G0 using pre-shock densities of 105 cm−3. In addition, comparing the observed fluxes and line ratios of several ionized hydrides such as C+, CH+, OH+, H2O+, and HCO+ with chemical models, Benz et al. (2016) constrained values of 200-400 G0 for NGC 1333 IRAS4A and 2–8 G0 for SMM1 at the Herschel half-power beam radius at 300 µm, which corresponds to a radius of 3000 and 5000 au from the center of the protostar at the distance of Perseus and Serpens, respectively. Using the IRAM 30m observations, similar G0 values were derived in Serpens Main by Mirocha et al. (2021), who computed ratios of CN to HCN column densities, a good tracer of UV fields around around low- and intermediate-mass protostellar cores. In our radiative transfer calculations, the radiation field spectrum computed in these regions has been entirely reprocessed toward longer wavelength photons (IR to millimeter wavelengths), which means the G0 is negligible there.
As suggested above, in outflow cavities the high-energy (UV) part of the radiation field spectrum must originate from the shocks occurring between the outflowing gas and the envelope. Therefore, it is not possible to precisely compare the radiation field obtained from radiative transfer calculations (where the radiation field emanating from the center is heavily reprocessed) with these chemical studies that only discuss the impact of the UV field on the chemistry. For reference, at 1000 au from the protostar our fiducial model (see Paper II) yields an irradiation field of urad/uISRF ≃ 3 × 10³ in the direction of the outflow and ~5 × 10² in the direction of the equatorial planes. At 3000 au from the protostar the ratio urad/uISRF is ~3.5 × 10² in the direction of the outflow and ~1 × 10² in the direction of the equatorial planes. The resulting grain alignment efficiency does not seem to be high enough to reproduce the results obtained with ALMA observations obtained in Le Gouellec et al. (2020). In addition, the higher values of irradiation we explore may favor the rotational disruption of grains and thus deteriorate the conditions for grain alignment removing the large grains. This latter point is quantitatively addressed in our Paper II. While irradiation appears to locally affect the grain alignment conditions, the global efficiency of the grain alignment mechanisms is also important to take into account. Le Gouellec et al. (2020) also noted that the paramagneticity of dust grains strongly affects the grain alignment efficiency. Recently detailed modeling by Hoang (2022), Hoang et al. (2022), and Chau Giang et al. (2022) have shown that to ensure the alignment of large dust grains (≥ 10 µm; necessary to reproduce the observed polarized dust emission), grains containing embedded iron inclusions are required to ensure efficient grain internal and external alignment processes with respect to the gas randomization (i.e., short Barnett relaxation and Larmor precession timescales with respect to the gaseous damping timescale).
4.3.2 Effect of C/O in the gas phase and the CCH abundance
In protoplanetary disks only models implementing C/O>1 can reproduce the high abundance of C2H (Bergin et al. 2016; Kama et al. 2016; Cleeves et al. 2018, 2021; Kastner et al. 2018; Miotello et al. 2019; Alarcón et al. 2020; Anderson et al. 2021; Facchini et al. 2021), otherwise CO would carry most of the carbon content. In disks, to obtain a high C/O ratio, one possible explanation is the enhancement of carbon via destruction (and/or photodesorption) of carbon grains and PAHs (Anderson et al. 2017), while a deficit in oxygen can be caused by grain growth and dust settling (Hogerheijde et al. 2011; Du et al. 2015, 2017; Salinas et al. 2016; Cleeves et al. 2018). However, Bergner et al. (2020) did not find that C2H formation is favored by CO depletion in a few of Class 0/I systems, suggesting that CO can already be quite depleted in the gas phase. In outflow cavity walls, PDR-like modeling is required to fully understand the exact role of the UV radiation field in the enhancement of C2H, but the C/O ratio is a parameter that may also play a role in the C2H enhancement, in this active region separating the warm outflow material from the dense cold infalling envelope. In this region the temperature gradient is expected to be large because of the large gas density gradient across cavity walls and reprocessing of the local irradiation field. It is possible that in these specific conditions, the gas experiences a rather sharp transition from cold envelope conditions to temperatures allowing the CO sublimation out of dust grains (Anderl et al. 2016). C2H might be detected where a high C/O ratio could be explained by a limited CO sublimation. This is illustrated by the dichotomy found in BHR71 IRS2 between the outflow cavity and inner envelope traced by CO and C18O, respectively, and the cold envelope traced by N2D+ where CO freezes out onto dust grains (Hull et al. 2020; see also the unpolarized southern region of B335 in Fig. 1 compared to these same molecular lines presented in Cabedo et al. 2021, 2023). The dust polarization detected in the outflow cavity walls of IRS2 lies precisely between the regions where the N2D+ and CO emission lines peak, suggesting that dust grains cannot become aligned in these areas. This can be explained by the attenuation of the irradiation field, which is able to align far fewer grains. In addition, another cause of the drop in polarized intensity where CO freezes out onto grains could be that CO ices on grain surfaces decrease the helicity of the dust grains, and thus the polarization. Modeling dust grain surfaces and volatile chemistry toward the outflow cavity walls will be required to constrain the role played by the C/O ratio and the radiation field spectrum and strength in the observed warm carbon chemistry, and potentially the grain alignment conditions.
4.3.3 Understanding the origin of polarized dust in cavity walls via gas kinematic studies
The regions traced by C2H and CS around the lobes of bipolar outflows are thought to correspond to outflow cavities walls, because of their irradiated nature. Assuming that the polarized dust emission and the UV-sensitive molecular emission lines both come from these cavity walls, it is necessary to characterize the kinematic nature of outflow cavity walls to further constrain the physical conditions that favor grain alignment. Zhang et al. (2016) have proposed tentative evidence of a slowly moving rotating outflow using CS, suggesting that cavity walls are entrained by a rotating disk wind launched at large radii from the source. Further evidence of rotation toward Class 0 objects was found by Zhang et al. (2018) and Ohashi et al. (2022) using CS and C2H. The authors argue that these molecules should trace the gas entrained by the outflow along the cavity walls, or the magneto-centrifugal wind itself launched from the disk, rather than the gas infalling from the envelope to the central object. Even if the rotation of the outflow cavity walls is minimal, it has been suggested from observations of a few objects that the specific angular momentum of the corresponding gas is greater than that of the infalling-rotating envelope (Oya et al. 2018; Zhang et al. 2018). We note, however, that Okoda et al. (2018) have concluded that the C2H emission in a warm carbon-chain chemistry (WCCC) protostar was preferentially tracing gas from the infalling-rotating envelope. They attribute the C2H emission, also detected around outflow cavity, to the infalling-rotating envelope.
In Class 0 protostars it is thus still unclear whether the emission from the C2H molecule originates from the regions surrounding outflow cavities rather than from the outflowing gas itself. However, outflow cavity walls regions are subject to a significant shear. The material located at the interface between the outflowing gas and the infalling envelope material must experience turbulent mixing. The mixing layer is replenished by outflowing material and infalling envelope at a rate that is proportional to the mass outflow rate, but the mass brought to the mixing layer by the outward shocked wind should be larger than the mass brought by the infalling envelope (see Canto & Raga 1991; Liang et al. 2020, where this result was quantified via analytical models). Liang et al. (2020) developed a model of a steady-state cavity caused by the interaction of a wind with an infalling rotating envelope, whose size is dictated by the equilibrium between the wind ram pressure and envelope thermal pressure. They were able to match their predictions of the warm turbulent mixing layer with the broad-line profile of high-J CO line observed with Herschel toward Serpens SMM1 (Kristensen et al. 2017b). In this source the mixing layer is made of warm gas (T ~ 250 K), due to the competition between turbulent heating, expansion, and CO cooling.
It is still unclear whether the regions of high dust polarization and C2H emission belong to the outflowing gas, the mixing layer, or the infalling envelope. This question is of great importance given the local physical conditions required by grain alignment, especially the maximum size of aligned dust grains (Valdivia et al. 2019; Le Gouellec et al. 2019; Hull et al. 2020). To discuss the presence of large grains (≥ 10 µm) in cavity walls, we must address the question of where and when the required dust grain growth has occurred. Dust growth may be efficient in situ, within the infalling material of the protostellar envelope (Galametz et al. 2019; Bate 2022; infalling structures such as streamers may also favor dust grain growth thanks to their higher density). However, if the material producing the polarized dust emission in outflow cavity walls is entrained by a disk wind, large dust grains in cavities could originate from the much denser regions of the inner circumstellar disk where the outflow originates, and where grains grow more quickly. Recent studies have investigated the possibility of dust ejection from the inner disk (Wong et al. 2016; Liffman et al. 2020; Vinkovic & Čemeljić 2021; Hutchison & Clarke 2021; Booth & Clarke 2021; Tsukamoto et al. 2021; Rodenkirch & Dullemond 2022). Kinematic studies via observations of the spectral lines tracing those highly polarized regions could thus clarify which of these two scenarios can explain the spatial origin of these large grains.
Additionally, mechanical grain alignment may also play a role in regions harboring anisotropic (supersonic) gas-dust drift velocity streams. Originally, the Gold alignment (Gold 1952) was proposed to align the grains with long axes along the flow in supersonic conditions. More recently, the alignment of irregular grains induced by gaseous collisions was introduced in Lazarian (2007). This mechanical torque (MET) alignment mechanism acts similarly to that caused by RATs, where mechanical torques are applied by gas particle momentum instead of the photon momentum. Recent numerical quantification have shown a large range of grain spin-up efficiencies by METs for different grain shapes and gas-dust drift velocities (Hoang et al. 2018; Reissl et al. 2022). Alignment would occur with respect to the orientation of the average gas-dust drift velocity component or the magnetic field, depending on the amount of the iron inclusions and the gas-dust drift velocity (Lazarian & Hoang 2021; Hoang et al. 2022). In protostellar environments, unlike the infalling streams of gas located within the envelope, the outflow cavity walls are next to high velocity outflowing gas. The shocked layers defining the interaction between the outflowing gas and the envelope may exhibit favorable conditions for the mechanical alignment of dust grains. However, the width of the shock fronts would likely be small compared to the angular resolution of the observations presented here (see, e.g., Mottram et al. 2014; Kristensen et al. 2017b), such that the polarized dust emission would not be dominated by the shock front. The turbulent mixing layer (see Canto & Raga 1991; Liang et al. 2020), marking the transition between the outflowing and infalling velocities, could extend to a larger area. The gas-dust drift would be less anisotropic, but the (sub)millimeter polarized dust emission more likely emanates from this region. It is still unclear what the relative contributions of RATs and METs are in outflow cavity walls. Revealing this question would require precisely constraining the gas-dust drift velocities and irradiation conditions undergone by the dust grains responsible for the observed (sub)millimeter polarized dust emission.
5 Conclusions and summary
We compared the spatial distribution of polarized dust emission with molecular emission line of UV-sensitive species in the envelope of Class 0 protostars (B335, L1448 IRS2, NGC 1333 IRAS4A, Serpens Emb 8, and 8(N)). The goal was to use the warm chemistry processes to characterize the role of the radiation field in grain alignment within the dense envelope of protostars. The main results and conclusions of this paper are as follows:
We qualitatively compare the observed maps of dust polarization with maps of the irradiated regions probed by UV-driven chemistry traced by the emission of the C2H hydrocarbon. The emission of this molecule is seen to be enhanced along outflow cavities walls, where in the case of the axisymmetric cores the polarized dust emission is also enhanced.
In the case of a more turbulent core, such as Serpens Emb 8, the energetic photons probed by the C2H emission seem to propagate throughout the entire inner core. In this source, the polarized intensity exhibits very localized detections, with only tentative correlations with the location of C2H molecular gas emission.
We show that the shock tracer SO also peaks toward outflow cavities where polarized dust emission is enhanced. Shocks happening along cavity walls can represent an additional source of high-energy photons that may contribute to the anisotropic radiation field aligning grains via radiative torques.
In the two protostars presenting the best detection of both the polarized dust emission and the C2H emission, we find a quantitative correlation between the morphology of the polarized intensity and C2H moment 0 integrated emission maps, suggesting that the radiation field impinging on the cavity walls may favor both the grain alignment and the warm carbon chain chemistry in these regions.
However, some regions of Class 0 protostellar envelopes, which are thought to be under a weaker radiation field, still exhibit enhanced polarized intensity, such as the northern equatorial mid-plane of B335, contrary to the southern one. This may suggest that a fraction of dust grains contributing to the millimeter dust continuum emission may be aligned even in the absence of an ultraviolet radiation field, but with a strongly reddened radiation field.
Comparing the ambient chemistry that develops where dust polarization is observed opens a promising avenue to further constrain grain alignment, given that the modeling of the results from these two fields can constrain crucial parameters together, such as radiation field, dust temperature, and the subsequent sublimation radii beyond which gas species can freeze onto dust grains, potentially modifying their alignment properties. We highlight the importance of source geometry and evolution in setting the environmental conditions of the envelope of protostars, which in turn govern the capability of radiative torques to align dust grains depending on the spectrum of local photons.
Acknowledgements
V.J.M.L.G. thanks Ł. Tychoniec, N. Sakai, and J. M. Girart for their help and support regarding the ALMA molecular lines and dust polarization observations presented in this paper. V.J.M.L.G. and C.L.H.H. acknowledge the ESO Studentship Program, and the guidance and support of Eric Villard. C.L.H.H. acknowledges the support of both the NAOJ Fellowship as well as JSPS KAKENHI grant 18K13586. This work has received support from the European Research Council (ERC Starting Grant MagneticYSOs with grant agreement no. 679937). This paper makes use of the following ALMA data: ADS/JAO.ALMA#2013.1.01102.S, ADS/JAO.ALMA#2016.1.01552.S, ADS/JAO.ALMA#2017.1.01392.S, ADS/JAO.ALMA#2013.1.01380.S, ADS/JAO.ALMA#2018.1.01873.S, ADS/JAO.ALMA#2016.1.01501.S, ADS/JAO. ALMA#2016.1.00604.S, ADS/JAO.ALMA#2013.1.00031.S, ADS/JAO.ALMA #2016.1.01089.S, ADS/JAO.ALMA#2013.1.01102.S, ADS/JAO.ALMA#2016. 1.01089.S, ADS/JAO.ALMA#2015.1.00546.S., ADS/JAO.ALMA#2017.1.01174. S, ADS/JAO.ALMA#2016.1.00710.S, ADS/JAO.ALMA#2013.1.00726.S, ADS/JAO.ALMA#2015.1.00768.S. ALMA is a partnership of ESO (representing its member states), NSF (USA) and NINS (Japan), together with NRC (Canada), MOST and ASIAA (Taiwan), and KASI (Republic of Korea), in cooperation with the Republic of Chile. The Joint ALMA Observatory is operated by ESO, AUI/NRAO and NAOJ. The National Radio Astronomy Observatory is a facility of the National Science Foundation operated under cooperative agreement by Associated Universities, Inc. Facilities: ALMA. Software: APLpy, an open-source plotting package for Python hosted at https://aplpy.github.io/ (Robitaille & Bressert 2012). CASA (McMullin et al. 2007). Astropy (Astropy Collaboration 2018). POLARIS (Reissl et al. 2016).
Appendix A Additional tracers of warm chemistry in outflow cavities
We present here maps of two additional tracers of warm chemistry, CS and c-C3H2 (see Table 2 for the transition information). The molecule c-C3H2 has a similar chemistry to that of C2H. Like C2H, it has been detected toward the PDR edges (Teyssier et al. 2004; Pety et al. 2005; Cuadrado et al. 2015; Guzmán et al. 2014, 2015), and is likely an irradiation tracer. Detections of c-C3H2 have been found at the scale of cores (~2000 – 4000 au) toward proto-stellar and pre-stellar cores irradiated by external sources, suggesting irradiation driven chemistry (a nearby star, for example, or the interstellar radiation field itself; see Lindberg & Jørgensen 2012; Spezzano et al. 2016). c-C3H2 (and C2H) can also probe the disk–envelope interface, at the limit between the centrifugal barrier and the infalling-rotating envelope (Sakai et al. 2014a,b). CS is also a molecule whose emission can be enhanced at the edges of PDR (Rivière-Marichalar et al. 2019). Commonly seen toward outflow cavities tracing the warm molecular layer (Kwon et al. 2015; Bjerkeli et al. 2016b; Oya et al. 2018; Zhang et al. 2016; Martín-Doménech et al. 2019; Zhang et al. 2018; Okoda et al. 2020; Taquet et al. 2020), CS may trace the UV-irradiated regions of disks as well (Podio et al. 2020a,b). We note, however, in disks seen edge-on that CS can appear below CN, whose production is favored by the irradiation of the disk surface (Ruíz-Rodríguez et al. 2021). The chemical formation route of CS may require strong UV radiation as it can trigger reactions between S/S+ and small hydrocarbons to produce carbonated S-species, or photodesorption from dust grains (LeGal et al. 2019; Podio et al. 2020b). In the protostars we study, CS is less obviously tracing the PDR-like outflow cavity wall layer because its spectral emission has a narrower profile than SO, but a broader extent compared to that of C2H that only peaks at the υlsr (see the kinematic study present in Figure 6; see also Tychoniec et al. 2021; Ohashi et al. 2022). In addition, applying the method presented in Section 3 on the P and CS moment 0 maps of B335 and L1448 IRS2 does not result in any probing results (especially for L1448 IRS2), suggesting that the morphology of the CS moment 0 map is less linked to outflow cavity walls.
B335: Figure A.1 presents the c-C3H2 and CS moment 0 integrated emission maps from Imai et al. (2016). The emission of the carbon chain molecule c-C3H2, and the CS molecular emission, are clearly enhanced toward the outflow cavities. The c-C3H2 emission is very faint, however, and is located exclusively at the base of outflow cavity walls.
L1448 IRS2: Figure A.2 presents the CS moment 0 integrated emission map (from Y. Zhang in prep., ALMA project 2016.1.01501.S, PI: N. Sakai) The C2H molecular line shown in Figure 2, is more extended than CS, but emission from both molecular lines appears enhanced toward the walls of the cavities.
NGC1333 IRAS4A: Figure A.3 presents the CS moment 0 integrated emission map from Chuang et al. (2021). The polarized dust emission along the outflow cavity walls seems to overlap precisely with the CS molecular emission line in the southern cavity of IRAS4A1 and IRAS4A2, and in the northern cavity of IRAS4A1.
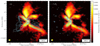 |
Fig. A.1 Polarized intensity and molecular line observations around the B335 Class 0 protostellar core (as in Figure 1). The thick light blue contours trace the moment 0 map of the CS (from 6 to 11 km s−1) and c-C3H2 (from 7 to 9.5 km s−1) molecular emission spectral line, at levels of 3, 5, 7, 9, 11, 16, 24, 44 × the rms noise level of each map. In the bottom left corner of each plot the ellipses represent the beam resolution element of a given dataset: yellow for polarized dust emission; white for the CS and c-C3H2 spectral emission lines. ALMA 1.3mm dust polarized emission from Maury et al. (2018) and Maury et al. (in prep.). The CS and c-C3H2 emission lines are from Imai et al. (2016). |
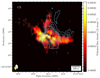 |
Fig. A.2 Magnetic fields, polarized intensity, and molecular line observations around the L1448 IRS2 Class 0 protostellar core (as in Figure 2). The thick light blue contours (top right and bottom panels) trace the moment 0 map of the CS (by integrating emission from 2 to 6 km s−1) molecular emission spectral line. The ALMA 1.3mm dust polarized emission is from Kwon et al. (2019) and the CS emission line is from ALMA project 2016.1.01501.S, Y. Zhang (in prep.). |
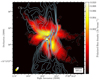 |
Fig. A.3 Magnetic fields, polarized intensity, and molecular line observations around the NC1333 IRAS4A Class 0 protostellar core (as in Figure 3). The thick light blue contours (top right and bottom panels) trace the moment 0 map of the CS (by integrating emission from -10 to 19.5 km s−1) molecular emission spectral line. The two crosses are located at the two peaks of the dust continuum map. IRAS4A1 is to the southeast of IRAS4A2. The ALMA 1.3mm dust polarized emission is from Ko et al. (2020). The CS emission line is from Chuang et al. (2021). |
Appendix B Details about our geometrical comparisons between the maps of polarized intensity and integrated molecular emission line
Figure B.1 presents the emission profiles of the S/N selected lines obtained in the C2H moment 0 and P maps of B335 from the method presented in Section 3. These profiles correspond to the black and white lines in Figure 7.
Figures B.2 and B.3 present the same tests presented in Section 3, but applied to L1448 IRS2, using N=100 and n=1000. This time the departure of the lines is offset by ~ 50 au from the peak of the total intensity map. We chose this because the central region is thought to be optically thick and the corresponding polarized emission to be contaminated by self-scattering (Kwon et al. 2019). As in B335, the KS test results suggest that the two distributions (σ,µ) between the C2H moment 0 and P maps in L1448 IRS2 could come from a common parent distribution. Therefore, in this core the morphology of the emission in these two maps could also have a common origin.
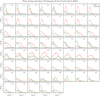 |
Fig. B.1 Emission profiles of the S/N selected lines obtained in the C2H moment 0 and P maps of B335. The red and green solid line corresponds to the emission profile along a given line of the C2H moment 0 and P map, respectively, shown in Figure 7. The angle in each panel is the position angle (taken from the north) of the line (see Figure 7). When the 1D Gaussian fit converges (for the white lines in Figure 7), it is shown as a dashed line. |
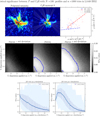 |
Fig. B.2 Results from the two-sided 1D and 2D KS tests between the P and C2H moment 0 maps of L1448 IRS2, performed with N=100 and n=1000. Same as Figure 7. |
 |
Fig. B.3 Plots of lines and their 1D Gaussian fit for P and C2H in B335. |
References
- Alarcón, F., Teague, R., Zhang, K., Bergin, E.A., & Barraza-Alfaro, M. 2020, ApJ, 905, 68 [CrossRef] [Google Scholar]
- Anderl, S., Maret, S., Cabrit, S., et al. 2016, A&A, 591, A3 [NASA ADS] [CrossRef] [EDP Sciences] [Google Scholar]
- Anderson, D.E., Bergin, E.A., Blake, G.A., et al. 2017, ApJ, 845, 13 [NASA ADS] [CrossRef] [Google Scholar]
- Anderson, D.E., Blake, G.A., Cleeves, L.I., et al. 2021, ApJ, 909, 55 [NASA ADS] [CrossRef] [Google Scholar]
- Andersson, B.-G., Lazarian, A., & Vaillancourt, J.E. 2015, ARA&A, 53, 501 [NASA ADS] [CrossRef] [Google Scholar]
- Andre, P., & Montmerle, T. 1994, ApJ, 420, 837 [NASA ADS] [CrossRef] [Google Scholar]
- Andre, P., Ward-Thompson, D., & Barsony, M. 1993, ApJ, 406, 122 [NASA ADS] [CrossRef] [Google Scholar]
- Arce, H.G., Shepherd, D., Gueth, F., et al. 2007, in Protostars and Planets V, eds. B. Reipurth, D. Jewitt, & K. Keil (Tucson: University of Arizona Press), 245 [Google Scholar]
- Astropy Collaboration (Price-Whelan, A.M., et al.) 2018, AJ, 156, 123 [NASA ADS] [CrossRef] [Google Scholar]
- Bachiller, R., & Tafalla, M. 1999, The Origin of Stars and Planetary Systems, eds. C.J. Lada, & N.D. Kylafis (Berlin: Springer), 540, 227 [NASA ADS] [CrossRef] [Google Scholar]
- Bally, J. 2016, ARA&A, 54, 491 [Google Scholar]
- Bate, M.R. 2022, MNRAS, 514, 2145 [CrossRef] [Google Scholar]
- Benz, A.O., Bruderer, S., van Dishoeck, E.F., et al. 2016, A&A, 590, A105 [NASA ADS] [CrossRef] [EDP Sciences] [Google Scholar]
- Bergin, E.A., Du, F., Cleeves, L.I., et al. 2016, ApJ, 831, 101 [CrossRef] [Google Scholar]
- Bergner, J.B., Öberg, K.I., Bergin, E.A., et al. 2019, ApJ, 876, 25 [NASA ADS] [CrossRef] [Google Scholar]
- Bergner, J.B., Öberg, K.I., Bergin, E.A., et al. 2020, ApJ, 898, 97 [NASA ADS] [CrossRef] [Google Scholar]
- Bjerkeli, P., Jørgensen, J.K., & Brinch, C. 2016a, A&A, 587, A145 [NASA ADS] [CrossRef] [EDP Sciences] [Google Scholar]
- Bjerkeli, P., Jørgensen, J.K., Bergin, E.A., et al. 2016b, A&A, 595, A39 [NASA ADS] [CrossRef] [EDP Sciences] [Google Scholar]
- Böhm, K.H., Noriega-Crespo, A., & Solf, J. 1993, ApJ, 416, 647 [CrossRef] [Google Scholar]
- Booth, R.A., & Clarke, C.J. 2021, MNRAS, 502, 1569 [NASA ADS] [CrossRef] [Google Scholar]
- Brogan, C.L., Hunter, T.R., & Fomalont, E.B. 2018, ArXiv e-prints [arXiv:1805.05266] [Google Scholar]
- Cabedo, V., Maury, A., Girart, J.M., & Padovani, M. 2021, A&A, 653, A166 [NASA ADS] [CrossRef] [EDP Sciences] [Google Scholar]
- Cabedo, V., Maury, A., Girart, J.M., et al. 2023, A&A, 669, A90 [NASA ADS] [CrossRef] [EDP Sciences] [Google Scholar]
- Canto, J., & Raga, A.C. 1991, ApJ, 372, 646 [NASA ADS] [CrossRef] [Google Scholar]
- Chau Giang, N., Hoang, T., Kim, J.-G., & Tram, L.N. 2022, ArXiv e-prints [arXiv:2210.01036] [Google Scholar]
- Chuang, C.-Y., Aso, Y., Hirano, N., Hirano, S., & Machida, M.N. 2021, ApJ, 916, 82 [NASA ADS] [CrossRef] [Google Scholar]
- Cleeves, L.I., Öberg, K.I., Wilner, D.J., et al. 2018, ApJ, 865, 155 [NASA ADS] [CrossRef] [Google Scholar]
- Cleeves, L.I., Loomis, R.A., Teague, R., et al. 2021, ApJ, 911, 29 [NASA ADS] [CrossRef] [Google Scholar]
- Cox, E.G., Harris, R.J., Looney, L.W., et al. 2018, ApJ, 855, 92 [NASA ADS] [CrossRef] [Google Scholar]
- Cuadrado, S., Goicoechea, J.R., Pilleri, P., et al. 2015, A&A, 575, A82 [NASA ADS] [CrossRef] [EDP Sciences] [Google Scholar]
- Curiel, S., Raymond, J.C., Wolfire, M., et al. 1995, ApJ, 453, 322 [NASA ADS] [CrossRef] [Google Scholar]
- de Valon, A., Dougados, C., Cabrit, S., et al. 2020, A&A, 634, L12 [NASA ADS] [CrossRef] [EDP Sciences] [Google Scholar]
- Draine, B.T., & Weingartner, J.C. 1996, ApJ, 470, 551 [NASA ADS] [CrossRef] [Google Scholar]
- Draine, B.T., & Weingartner, J.C. 1997, ApJ, 480, 633 [NASA ADS] [CrossRef] [Google Scholar]
- Du, F., Bergin, E.A., & Hogerheijde, M.R. 2015, ApJ, 807, L32 [NASA ADS] [CrossRef] [Google Scholar]
- Du, F., Bergin, E.A., Hogerheijde, M., et al. 2017, ApJ, 842, 98 [NASA ADS] [CrossRef] [Google Scholar]
- Enoch, M.L., Evans, N.J., II, Sargent, A.I., & Glenn, J. 2009, ApJ, 692, 973 [NASA ADS] [CrossRef] [Google Scholar]
- Enoch, M.L., Corder, S., Duchêne, G., et al. 2011, ApJS, 195, 21 [NASA ADS] [CrossRef] [Google Scholar]
- Facchini, S., Teague, R., Bae, J., et al. 2021, AJ, 162, 99 [NASA ADS] [CrossRef] [Google Scholar]
- Fasano, G., & Franceschini, A. 1987, MNRAS, 225, 155 [NASA ADS] [CrossRef] [Google Scholar]
- Fuente, A., Martin-Pintado, J., Cernicharo, J., & Bachiller, R. 1993, A&A, 276, 473 [NASA ADS] [Google Scholar]
- Galametz, M., Maury, A.J., Valdivia, V., et al. 2019, A&A, 632, A5 [NASA ADS] [CrossRef] [EDP Sciences] [Google Scholar]
- Geers, V.C., van Dishoeck, E.F., Pontoppidan, K.M., et al. 2009, A&A, 495, 837 [NASA ADS] [CrossRef] [EDP Sciences] [Google Scholar]
- Girart, J.M., Rao, R., & Marrone, D.P. 2006, Science, 313, 812 [CrossRef] [Google Scholar]
- Goicoechea, J.R., Cernicharo, J., Karska, A., et al. 2012, A&A, 548, A77 [NASA ADS] [CrossRef] [EDP Sciences] [Google Scholar]
- Gold, T. 1952, MNRAS, 112, 215 [NASA ADS] [Google Scholar]
- Greene, T.P., Gully-Santiago, M.A., & Barsony, M. 2018, ApJ, 862, 85 [NASA ADS] [CrossRef] [Google Scholar]
- Gustafsson, M., Ravkilde, T., Kristensen, L.E., et al. 2010, A&A, 513, A5 [NASA ADS] [CrossRef] [EDP Sciences] [Google Scholar]
- Guzmán, V.V., Pety, J., Gratier, P., et al. 2014, Faraday Discuss., 168, 103 [CrossRef] [Google Scholar]
- Guzmán, V.V., Pety, J., Goicoechea, J.R., et al. 2015, ApJ, 800, L33 [CrossRef] [Google Scholar]
- Hartmann, L., Herczeg, G., & Calvet, N. 2016, ARA&A, 54, 135 [Google Scholar]
- Henning, T., Semenov, D., Guilloteau, S., et al. 2010, ApJ, 714, 1511 [Google Scholar]
- Higuchi, A.E., Sakai, N., Watanabe, Y., et al. 2018, ApJS, 236, 52 [CrossRef] [Google Scholar]
- Hoang, T. 2022, ApJ, 928, 102 [NASA ADS] [CrossRef] [Google Scholar]
- Hoang, T., & Tram, L.N. 2019, ApJ, 877, 36 [NASA ADS] [CrossRef] [Google Scholar]
- Hoang, T., Cho, J., & Lazarian, A. 2018, ApJ, 852, 129 [NASA ADS] [CrossRef] [Google Scholar]
- Hoang, T., Tram, L.N., Lee, H., Diep, P.N., & Ngoc, N.B. 2021, ApJ, 908, 218 [NASA ADS] [CrossRef] [Google Scholar]
- Hoang, T., Tram, L.N., Phan, V.H.M., et al. 2022, AJ, 164, 248 [NASA ADS] [CrossRef] [Google Scholar]
- Hogerheijde, M.R., Jansen, D.J., & van Dishoeck, E.F. 1995, A&A, 294, 792 [NASA ADS] [Google Scholar]
- Hogerheijde, M.R., van Dishoeck, E.F., Blake, G.A., & van Langevelde, H.J. 1998, ApJ, 502, 315 [NASA ADS] [CrossRef] [Google Scholar]
- Hogerheijde, M.R., Bergin, E.A., Brinch, C., et al. 2011, Science, 334, 338 [NASA ADS] [CrossRef] [Google Scholar]
- Hull, C.L.H., & Plambeck, R.L. 2015, J. Astron. Instrum., 4, 1550005 [NASA ADS] [CrossRef] [Google Scholar]
- Hull, C.L.H., Girart, J.M., Tychoniec, L., et al. 2017a, ApJ, 847, 92 [NASA ADS] [CrossRef] [Google Scholar]
- Hull, C.L.H., Mocz, P., Burkhart, B., et al. 2017b, ApJ, 842, L9 [NASA ADS] [CrossRef] [Google Scholar]
- Hull, C.L.H., Le Gouellec, V.J.M., Girart, J.M., Tobin, J.J., & Bourke, T.L. 2020, ApJ, 892, 152 [NASA ADS] [CrossRef] [Google Scholar]
- Hutchison, M.A., & Clarke, C.J. 2021, MNRAS, 501, 1127 [Google Scholar]
- Imai, M., Sakai, N., Oya, Y., et al. 2016, ApJ, 830, L37 [CrossRef] [Google Scholar]
- Jansen, D.J., Spaans, M., Hogerheijde, M.R., & van Dishoeck, E.F. 1995, A&A, 303, 541 [NASA ADS] [Google Scholar]
- Jørgensen, J.K., Visser, R., Sakai, N., et al. 2013, ApJ, 779, L22 [CrossRef] [Google Scholar]
- Kama, M., Bruderer, S., van Dishoeck, E.F., et al. 2016, A&A, 592, A83 [NASA ADS] [CrossRef] [EDP Sciences] [Google Scholar]
- Karska, A., Kaufman, M.J., Kristensen, L.E., et al. 2018, ApJS, 235, 30 [NASA ADS] [CrossRef] [Google Scholar]
- Kastner, J.H., Hily-Blant, P., Rodriguez, D.R., Punzi, K., & Forveille, T. 2014, ApJ, 793, 55 [NASA ADS] [CrossRef] [Google Scholar]
- Kastner, J.H., Qi, C., Gorti, U., et al. 2015, ApJ, 806, 75 [NASA ADS] [CrossRef] [Google Scholar]
- Kastner, J.H., Qi, C., Dickson-Vandervelde, D.A., et al. 2018, ApJ, 863, 106 [NASA ADS] [CrossRef] [Google Scholar]
- Ko, C.-L., Liu, H.B., Lai, S.-P., et al. 2020, ApJ, 889, 172 [NASA ADS] [CrossRef] [Google Scholar]
- Kristensen, L.E., van Dishoeck, E.F., Bergin, E.A., et al. 2012, A&A, 542, A8 [NASA ADS] [CrossRef] [EDP Sciences] [Google Scholar]
- Kristensen, L.E., van Dishoeck, E.F., Benz, A.O., et al. 2013, A&A, 557, A23 [NASA ADS] [CrossRef] [EDP Sciences] [Google Scholar]
- Kristensen, L.E., Gusdorf, A., Mottram, J.C., et al. 2017a, A&A, 601, L4 [CrossRef] [EDP Sciences] [Google Scholar]
- Kristensen, L.E., van Dishoeck, E.F., Mottram, J.C., et al. 2017b, A&A, 605, A93 [NASA ADS] [CrossRef] [EDP Sciences] [Google Scholar]
- Krumholz, M.R., Klein, R.I., & McKee, C.F. 2012, ApJ, 754, 71 [NASA ADS] [CrossRef] [Google Scholar]
- Kurono, Y., Saito, M., Kamazaki, T., Morita, K.-I., & Kawabe, R. 2013, ApJ, 765, 85 [NASA ADS] [CrossRef] [Google Scholar]
- Kwon, W., Fernández-López, M., Stephens, I.W., & Looney, L.W. 2015, ApJ, 814, 43 [NASA ADS] [CrossRef] [Google Scholar]
- Kwon, W., Stephens, I.W., Tobin, J.J., et al. 2019, ApJ, 879, 25 [NASA ADS] [CrossRef] [Google Scholar]
- Lazarian, A. 2007, J. Quant. Spectrosc. Radiat. Transf., 106, 225 [NASA ADS] [CrossRef] [Google Scholar]
- Lazarian, A., & Hoang, T. 2007, MNRAS, 378, 910 [Google Scholar]
- Lazarian, A., & Hoang, T. 2021, ApJ, 908, 12 [NASA ADS] [CrossRef] [Google Scholar]
- Le Gouellec, V.J.M., Hull, C.L.H., Maury, A.J., et al. 2019, ApJ, 885, 106 [NASA ADS] [CrossRef] [Google Scholar]
- Le Gouellec, V.J.M., Maury, A.J., Guillet, V., et al. 2020, A&A, 644, A11 [NASA ADS] [CrossRef] [EDP Sciences] [Google Scholar]
- Lee, S., Lee, J.-E., & Bergin, E.A. 2015, ApJS, 217, 30 [NASA ADS] [CrossRef] [Google Scholar]
- Lee, S., Lee, J.-E., Aikawa, Y., Herczeg, G., & Johnstone, D. 2020, ApJ, 889, 20 [NASA ADS] [CrossRef] [Google Scholar]
- Lee, Y.-N., Charnoz, S., & Hennebelle, P. 2021, A&A, 648, A101 [NASA ADS] [CrossRef] [EDP Sciences] [Google Scholar]
- Lefloch, B., Cernicharo, J., Cabrit, S., & Cesarsky, D. 2005, A&A, 433, 217 [NASA ADS] [CrossRef] [EDP Sciences] [Google Scholar]
- LeGal, R., Öberg, K.I., Loomis, R.A., Pegues, J., & Bergner, J.B. 2019, ApJ, 876, 72 [NASA ADS] [CrossRef] [Google Scholar]
- Lehmann, A., Godard, B., Pineau des Forêts, G., & Falgarone, E. 2020, A&A, 643, A101 [EDP Sciences] [Google Scholar]
- Liang, L., Johnstone, D., Cabrit, S., & Kristensen, L.E. 2020, ApJ, 900, 15 [NASA ADS] [CrossRef] [Google Scholar]
- Liffman, K., Bryan, G., Hutchison, M., & Maddison, S.T. 2020, MNRAS, 493, 4022 [CrossRef] [Google Scholar]
- Lindberg, J.E., & J0rgensen, J.K. 2012, A&A, 548, A24 [NASA ADS] [CrossRef] [EDP Sciences] [Google Scholar]
- Louvet, F., Dougados, C., Cabrit, S., et al. 2018, A&A, 618, A120 [NASA ADS] [CrossRef] [EDP Sciences] [Google Scholar]
- Martín-Doménech, R., Bergner, J.B., Öberg, K.I., & J0rgensen, J.K. 2019, ApJ, 880, 130 [CrossRef] [Google Scholar]
- Maury, A.J., Girart, J.M., Zhang, Q., et al. 2018, MNRAS, 477, 2760 [NASA ADS] [CrossRef] [Google Scholar]
- McMullin, J.P., Waters, B., Schiebel, D., Young, W., & Golap, K. 2007, ASP Conf. Ser., 376, 127 [NASA ADS] [Google Scholar]
- Miotello, A., Facchini, S., van Dishoeck, E.F., et al. 2019, A&A, 631, A69 [NASA ADS] [CrossRef] [EDP Sciences] [Google Scholar]
- Mirocha, A., Karska, A., Gronowski, M., et al. 2021, A&A, 656, A146 [NASA ADS] [CrossRef] [EDP Sciences] [Google Scholar]
- Miura, H., Yamamoto, T., Nomura, H., et al. 2017, ApJ, 839, 47 [NASA ADS] [CrossRef] [Google Scholar]
- Mottram, J.C., Kristensen, L.E., van Dishoeck, E.F., et al. 2014, A&A, 572, A21 [NASA ADS] [CrossRef] [EDP Sciences] [Google Scholar]
- Murillo, N.M., Bruderer, S., van Dishoeck, E.F., et al. 2015, A&A, 579, A114 [NASA ADS] [CrossRef] [EDP Sciences] [Google Scholar]
- Murillo, N.M., van Dishoeck, E.F., van der Wiel, M.H.D., et al. 2018, A&A, 617, A120 [NASA ADS] [CrossRef] [EDP Sciences] [Google Scholar]
- Nagy, Z., Ossenkopf, V., Van der Tak, F.F.S., et al. 2015, A&A, 578, A124 [NASA ADS] [CrossRef] [EDP Sciences] [Google Scholar]
- Neufeld, D.A., & Dalgarno, A. 1989a, ApJ, 340, 869 [NASA ADS] [CrossRef] [Google Scholar]
- Neufeld, D.A., & Dalgarno, A. 1989b, ApJ, 344, 251 [NASA ADS] [CrossRef] [Google Scholar]
- Ohashi, S., Codella, C., Sakai, N., et al. 2022, ApJ, 927, 54 [NASA ADS] [CrossRef] [Google Scholar]
- Okoda, Y., Oya, Y., Sakai, N., et al. 2018, ApJ, 864, L25 [NASA ADS] [CrossRef] [Google Scholar]
- Okoda, Y., Oya, Y., Sakai, N., Watanabe, Y., & Yamamoto, S. 2020, ApJ, 900, 40 [NASA ADS] [CrossRef] [Google Scholar]
- Oya, Y., Sakai, N., Sakai, T., et al. 2014, ApJ, 795, 152 [NASA ADS] [CrossRef] [Google Scholar]
- Oya, Y., Sakai, N., Watanabe, Y., et al. 2018, ApJ, 863, 72 [NASA ADS] [CrossRef] [Google Scholar]
- Peacock, J.A. 1983, MNRAS, 202, 615 [NASA ADS] [CrossRef] [Google Scholar]
- Pety, J., Teyssier, D., Fossé, D., et al. 2005, A&A, 435, 885 [NASA ADS] [CrossRef] [EDP Sciences] [Google Scholar]
- Pety, J., Gratier, P., Guzmán, V., et al. 2012, A&A, 548, A68 [NASA ADS] [CrossRef] [EDP Sciences] [Google Scholar]
- Podio, L., Garufi, A., Codella, C., et al. 2020a, A&A, 642, L7 [NASA ADS] [CrossRef] [EDP Sciences] [Google Scholar]
- Podio, L., Garufi, A., Codella, C., et al. 2020b, A&A, 644, A119 [NASA ADS] [CrossRef] [EDP Sciences] [Google Scholar]
- Press, W.H., Teukolsky, S.A., Vetterling, W.T. 2007, Numerical Recipes: the Art of Scientific Computing (Cambridge: Cambridge University Press) [Google Scholar]
- Raga, A., & Cabrit, S. 1993, A&A, 278, 267 [Google Scholar]
- Reissl, S., Wolf, S., & Brauer, R. 2016, A&A, 593, A87 [NASA ADS] [CrossRef] [EDP Sciences] [Google Scholar]
- Reissl, S., Guillet, V., Brauer, R., et al. 2020, A&A 640, A118 [NASA ADS] [CrossRef] [EDP Sciences] [Google Scholar]
- Reissl, S., Meehan, P., & Klessen, R.S. 2022, ArXiv e-prints [arXiv:2201.03694] [Google Scholar]
- Rivière-Marichalar, P., Fuente, A., Goicoechea, J.R., et al. 2019, A&A, 628, A16 [NASA ADS] [CrossRef] [EDP Sciences] [Google Scholar]
- Robitaille, T., & Bressert, E. 2012, Astrophysics Source Code Library [record ascl:1208.017] [Google Scholar]
- Rodenkirch, P.J., & Dullemond, C.P. 2022, A&A, 659, A42 [NASA ADS] [CrossRef] [EDP Sciences] [Google Scholar]
- Ruíz-Rodríguez, D., Kastner, J., Hily-Blant, P., & Forveille, T. 2021, A&A, 646, A59 [NASA ADS] [CrossRef] [EDP Sciences] [Google Scholar]
- Sadavoy, S.I., Di Francesco, J., André, P., et al. 2014, ApJ, 787, L18 [NASA ADS] [CrossRef] [Google Scholar]
- Sakai, N., & Yamamoto, S. 2013, Chem. Rev., 113, 8981 [Google Scholar]
- Sakai, N., Sakai, T., Hirota, T., Burton, M., & Yamamoto, S. 2009, ApJ, 697, 769 [Google Scholar]
- Sakai, N., Oya, Y., Sakai, T., et al. 2014a, ApJ, 791, L38 [Google Scholar]
- Sakai, N., Sakai, T., Hirota, T., et al. 2014b, Nature, 507, 78 [Google Scholar]
- Salinas, V.N., Hogerheijde, M.R., Bergin, E.A., et al. 2016, A&A, 591, A122 [NASA ADS] [CrossRef] [EDP Sciences] [Google Scholar]
- Saucedo, J., Calvet, N., Hartmann, L., & Raymond, J. 2003, ApJ, 591, 275 [NASA ADS] [CrossRef] [Google Scholar]
- Spaans, M., Hogerheijde, M.R., Mundy, L.G., & van Dishoeck, E.F. 1995, ApJ, 455, L167 [NASA ADS] [Google Scholar]
- Spezzano, S., Bizzocchi, L., Caselli, P., Harju, J., & Brünken, S. 2016, A&A, 592, L11 [NASA ADS] [CrossRef] [EDP Sciences] [Google Scholar]
- Stäuber, P., Doty, S.D., van Dishoeck, E.F., Jørgensen, J.K., & Benz, A.O. 2004, A&A, 425, 577 [NASA ADS] [CrossRef] [EDP Sciences] [Google Scholar]
- Stäuber, P., Doty, S.D., van Dishoeck, E.F., & Benz, A.O. 2005, A&A, 440, 949 [NASA ADS] [CrossRef] [EDP Sciences] [Google Scholar]
- Taquet, V., Codella, C., De Simone, M., et al. 2020, A&A, 637, A63 [NASA ADS] [CrossRef] [EDP Sciences] [Google Scholar]
- Teyssier, D., Fossé, D., Gerin, M., et al. 2004, A&A, 417, 135 [NASA ADS] [CrossRef] [EDP Sciences] [Google Scholar]
- Tobin, J.J., Looney, L.W., Li, Z.-Y., et al. 2018, ApJ, 867, 43 [CrossRef] [Google Scholar]
- Tsukamoto, Y., Machida, M.N., & Inutsuka, S.-i. 2021, ApJ, 920, L35 [NASA ADS] [CrossRef] [Google Scholar]
- Tychoniec, E., Hull, C.L.H., Kristensen, L.E., et al. 2019, A&A, 632, A101 [NASA ADS] [CrossRef] [EDP Sciences] [Google Scholar]
- Tychoniec, E., van Dishoeck, E.F., van’t Hoff, M.L.R., et al. 2021, A&A, 655, A65 [NASA ADS] [CrossRef] [EDP Sciences] [Google Scholar]
- Valdivia, V., Maury, A., Brauer, R., et al. 2019, MNRAS, 488, 4897 [NASA ADS] [CrossRef] [Google Scholar]
- Valdivia, V., Maury, A., & Hennebelle, P. 2022, A&A, 668, A83 [NASA ADS] [CrossRef] [EDP Sciences] [Google Scholar]
- van der Wiel, M.H.D., van der Tak, F.F.S., Ossenkopf, V., et al. 2009, A&A, 498, 161 [NASA ADS] [CrossRef] [EDP Sciences] [Google Scholar]
- van Gelder, M.L., Tabone, B., Tychoniec, E., et al. 2020, A&A, 639, A87 [NASA ADS] [CrossRef] [EDP Sciences] [Google Scholar]
- van Gelder, M.L., Tabone, B., van Dishoeck, E.F., & Godard, B. 2021, A&A, 653, A159 [CrossRef] [EDP Sciences] [Google Scholar]
- van Kempen, T.A., van Dishoeck, E.F., Güsten, R., et al. 2009a, A&A, 501, 633 [NASA ADS] [CrossRef] [EDP Sciences] [Google Scholar]
- van Kempen, T.A., van Dishoeck, E.F., Güsten, R., et al. 2009b, A&A, 507, 1425 [NASA ADS] [CrossRef] [EDP Sciences] [Google Scholar]
- Vinkovic, D., & Cemeljié, M. 2021, MNRAS, 500, 506 [Google Scholar]
- Visser, R., Kristensen, L.E., Bruderer, S., et al. 2012, A&A, 537, A55 [NASA ADS] [CrossRef] [EDP Sciences] [Google Scholar]
- Walter, F.M., Herczeg, G., Brown, A., et al. 2003, AJ, 126, 3076 [NASA ADS] [CrossRef] [Google Scholar]
- Wardle, J.F.C., & Kronberg, P.P. 1974, ApJ, 194, 249 [NASA ADS] [CrossRef] [Google Scholar]
- Watson, D.M. 2020, Res. Notes Am. Astron. Soc., 4, 88 [Google Scholar]
- Wong, Y.H.V., Hirashita, H., & Li, Z.-Y. 2016, PASJ, 68, 67 [NASA ADS] [CrossRef] [Google Scholar]
- Yıldız, U.A., Kristensen, L.E., van Dishoeck, E.F., et al. 2012, A&A, 542, A86 [NASA ADS] [CrossRef] [EDP Sciences] [Google Scholar]
- Zhang, Y., Arce, H.G., Mardones, D., et al. 2016, ApJ, 832, 158 [NASA ADS] [CrossRef] [Google Scholar]
- Zhang, Y., Higuchi, A.E., Sakai, N., et al. 2018, ApJ, 864, 76 [NASA ADS] [CrossRef] [Google Scholar]
- Zucker, C., Speagle, J.S., Schlafly, E.F., et al. 2019, ApJ, 879, 125 [NASA ADS] [CrossRef] [Google Scholar]
Another source, the Class 0 B1-c in Perseus, originally triggered our interest. The ALMA C2H molecular emission line published in van Gelder et al. (2020); Tychoniec et al. (2021) exhibit an extended emission toward the bipolar outflow cavity and cavity walls. However, the 1.3 mm ALMA dust polarization observations published in Cox et al. (2018) suffers from a lack of sensitivity; only a few patches of polarized intensity are detected at the base of the outflow cavity.
All Tables
All Figures
|
Fig. 1 Observations of magnetic fields, polarized intensity, and molecular lines around the B335 Class 0 protostellar core. Left panel: line segments represent magnetic field lines, rotated by 90° from the dust polarization angle (the length of a segment does not represent a quantity). They are plotted where the polarized intensity P > 3σP. The gray scale is the total intensity (Stokes I) of the thermal dust emission, shown from 3σI. The white contours trace the total intensity at levels of 5, 8, 11, 16, 24, 44, 74, 128, 256 × σI. The blue and red contours trace the moment 0 map of the blueshifted (by integrating emission from −25 to 7 km s−1) and redshifted (by integrating emission from 10 to 35 km s−1) CO (J = 2 → 1) map at levels of 3, 5, 7, 9, 11, 16, 24, 44, 74, 128, 256, 400 × the rms noise level of the map. Right panel: in each panel the color scale is the dust polarization intensity, shown from 3σP. The crosses indicate the peak of the dust continuum map. The thin gray contours trace the dust polarization intensity, at levels of 3, 5, 7, 9, 11, 16, 24, 44 × σP. The thick light blue contours trace the moment 0 map of the C2H (by integrating emission from 7 to 12.5 km s−1) molecular emission spectral line (see Table 2 for details of the line transitions) at levels of 3, 5, 7, 9, 11, 16, 24, 44 × the rms noise level of each map. In the bottom left corner of each panel the ellipses represent the beam resolution element of a given dataset: yellow for polarized dust emission, red for CO bipolar outflow emission, and white for the CCH spectral emission line. The ALMA 1.3mm dust polarized emission is from Maury et al. (2018, and in prep.). The ALMA CO (J = 2 → 1) bipolar outflow emission is from Cabedo et al. (2021). The C2H emission line is from Imai et al. (2016). |
| In the text | |
|
Fig. 2 Same as Fig. 1, but for the L1448 IRS2 Class 0 protostellar core. The blue and red contours trace the moment 0 map of the blueshifted (by integrating emission from −16.5 to 3 km s−1) and redshifted (by integrating emission from 6 to 21.5 km s−1). The thick light blue contours (right panel) trace the moment 0 map of the C2H (by integrating emission from 3 to 8 km s−1) molecular emission spectral line. The ALMA 1.3 mm dust polarized emission is from Kwon et al. (2019). The ALMA CO (J = 2 → 1) bipolar outflow emission is from Tobin et al. (2018). The C2H emission line is from ALMA project 2016.1.01501.S, Y. Zhang (in prep.). |
| In the text | |
|
Fig. 3 Same as Fig. 1, but for the NC1333 IRAS4A Class 0 protostellar core. The blue and red contours trace the moment 0 map of the blueshifted (by integrating emission from −30 to 4 km s−1) and redshifted (by integrating emission from 10 to 55.5 km s−1). The thick light blue contours (top right and bottom panels) trace the moment 0 map of the C2H (by integrating emission from 2.5 to 15.5 km s−1) and SO (by integrating emission from −10 to 19.5 km s−1) molecular emission spectral line. The two crosses are located at the two peaks of the dust continuum map. IRAS4A1 is to the southeast of IRAS4A2. The ALMA 1.3mm dust polarized emission is from Ko et al. (2020). The ALMA CO(J = 2 → 1) bipolar outflow emission is from T.C. Ching 2016.1.01089.S. The SO emission is line from Chuang et al. (2021). |
| In the text | |
|
Fig. 4 Same as Fig. 1, but for the Serpens Emb 8 Class 0 protostellar core. The blue and red contours trace the moment 0 map of the blueshifted (by integrating emission from −10 to 6.5 km s−1) and redshifted (by integrating emission from 10 to 21 km s−1). The thick light blue contours (top right and bottom panels) trace the moment 0 map of the C2H (by integrating emission from 4.4 to 12.6 km s−1) and SO (by integrating emission from −1.5 to 15.5 km s−1) molecular emission spectral line. ALMA band 0.87mm dust polarized emission is from Hull et al. (2017a). ALMA CO (J = 2 → 1) bipolar outflow emission is from Le Gouellec et al. (2019). C2H and SO emission line is from van Gelder et al. (2020) and Tychoniec et al. (2021). |
| In the text | |
|
Fig. 5 Same as Fig. 1, but for the Serpens Emb 8(N) Class 0 protostellar core. The blue and red contours trace the moment 0 map of the blueshifted (by integrating emission from −10 to 6.5 km s−1) and redshifted (by integrating emission from 10 to 21 km s−1). The thick light blue contours (top right and bottom panels) trace the moment 0 map of the C2H (by integrating emission from 5.4 to 12.8 km s−1) and SO (by integrating emission from −16 to 8 km s−1, and from 10.5 to 35.5 km s−1) molecular emission spectral line. The ALMA band 0.87mm dust polarized emission, ALMA CO (J = 2 → 1) bipolar outflow emission, and C2H emission line are from Le Gouellec et al. (2019). The SO emission line is from ALMA project 2019.1.00931.S, Tychoniec et al. (in prep.). |
| In the text | |
|
Fig. 6 Spectra of molecular emission lines in NGC1333 IRAS4A2, Serpens Emb8, and Serpens Emb 8N. The solid lines show the spectra of the C2H, CS, and SO molecular emission lines, toward the north (top left panel) and the south (top right panel) of IRAS4A2. The spectra of the C2H and SO molecular emission lines toward the redshifted cavity of Serpens Emb 8, and the blueshifted cavity of Serpens Emb 8(N), are shown in the bottom left and bottom right panel, respectively. For IRAS4A, the emission is summed over a circle of 2.5.″ in diameter, centered on the two peaks of C2H visible in the integrated moment 0 map seen in Fig. 3. For Serpens Emb 8 and Serpens Emb 8(N), the spectra are from a circle of 1.″ in diameter located at 800 au from the center, in the redshifted and blueshifted cavity, respectively. In all cases, while the C2H hyperfine structure is detected at the υlsr, the spectra of CS and SO are clearly broader, suggesting material linked to the outflowing gas. |
| In the text | |
|
Fig. 7 Results from the two-sided 1D and 2D KS tests between the P and C2H moment 0 maps of B335, performed with N = 100 and n = 1000. Top row (left and middle): P and C2H moment 0 emission maps in color scale, respectively. Both maps are overlaid with the N lines, where the white lines correspond to the N′ sample of selected profiles. The red lines correspond to the profiles where the S/N selection criteria was not reached, and the black lines correspond to the profiles where the 1D Gaussian fit does not converge. Right: obtained (σ,µ) values from these 1D Gaussian fits in the form of a 2D diagram, with a linear regression line fitting both the σ and µ values. Middle row: results of the two-sided 2D KS tests, where each pixel corresponds to a given Gaussian distribution of width Σ, added on the sample of σ values (x-axis) and µ values (y-axis), obtained from the P map. The gray scale corresponds to the p-values obtained after n realizations. The left, middle, and right panels, show the mean p-value minus the standard deviation of p-values, the mean p-value, and the mean p-value plus the standard deviation of the obtained p-values, respectively. The blue contours correspond to p = 0.2. Bottom row: results of the two-sided 1D KS tests performed on the µ values (left panel) and on the σ values (right panel). In each panel the solid line and markers represent the resulting mean p-value as a function of Σ, which is the width of the Gaussian distribution added on the σ and µ values obtained from the P map. At each point, the shaded area shows the complete range of obtained p-values, while the error bars indicate the standard deviation of the distribution of p-values after n tries. Given our p rejection criteria of 0.2, we can infer that the two (σ,µ) distributions between the C2H moment 0 and P maps could come from a common parent distribution. |
| In the text | |
|
Fig. A.1 Polarized intensity and molecular line observations around the B335 Class 0 protostellar core (as in Figure 1). The thick light blue contours trace the moment 0 map of the CS (from 6 to 11 km s−1) and c-C3H2 (from 7 to 9.5 km s−1) molecular emission spectral line, at levels of 3, 5, 7, 9, 11, 16, 24, 44 × the rms noise level of each map. In the bottom left corner of each plot the ellipses represent the beam resolution element of a given dataset: yellow for polarized dust emission; white for the CS and c-C3H2 spectral emission lines. ALMA 1.3mm dust polarized emission from Maury et al. (2018) and Maury et al. (in prep.). The CS and c-C3H2 emission lines are from Imai et al. (2016). |
| In the text | |
|
Fig. A.2 Magnetic fields, polarized intensity, and molecular line observations around the L1448 IRS2 Class 0 protostellar core (as in Figure 2). The thick light blue contours (top right and bottom panels) trace the moment 0 map of the CS (by integrating emission from 2 to 6 km s−1) molecular emission spectral line. The ALMA 1.3mm dust polarized emission is from Kwon et al. (2019) and the CS emission line is from ALMA project 2016.1.01501.S, Y. Zhang (in prep.). |
| In the text | |
|
Fig. A.3 Magnetic fields, polarized intensity, and molecular line observations around the NC1333 IRAS4A Class 0 protostellar core (as in Figure 3). The thick light blue contours (top right and bottom panels) trace the moment 0 map of the CS (by integrating emission from -10 to 19.5 km s−1) molecular emission spectral line. The two crosses are located at the two peaks of the dust continuum map. IRAS4A1 is to the southeast of IRAS4A2. The ALMA 1.3mm dust polarized emission is from Ko et al. (2020). The CS emission line is from Chuang et al. (2021). |
| In the text | |
|
Fig. B.1 Emission profiles of the S/N selected lines obtained in the C2H moment 0 and P maps of B335. The red and green solid line corresponds to the emission profile along a given line of the C2H moment 0 and P map, respectively, shown in Figure 7. The angle in each panel is the position angle (taken from the north) of the line (see Figure 7). When the 1D Gaussian fit converges (for the white lines in Figure 7), it is shown as a dashed line. |
| In the text | |
|
Fig. B.2 Results from the two-sided 1D and 2D KS tests between the P and C2H moment 0 maps of L1448 IRS2, performed with N=100 and n=1000. Same as Figure 7. |
| In the text | |
|
Fig. B.3 Plots of lines and their 1D Gaussian fit for P and C2H in B335. |
| In the text | |
Current usage metrics show cumulative count of Article Views (full-text article views including HTML views, PDF and ePub downloads, according to the available data) and Abstracts Views on Vision4Press platform.
Data correspond to usage on the plateform after 2015. The current usage metrics is available 48-96 hours after online publication and is updated daily on week days.
Initial download of the metrics may take a while.