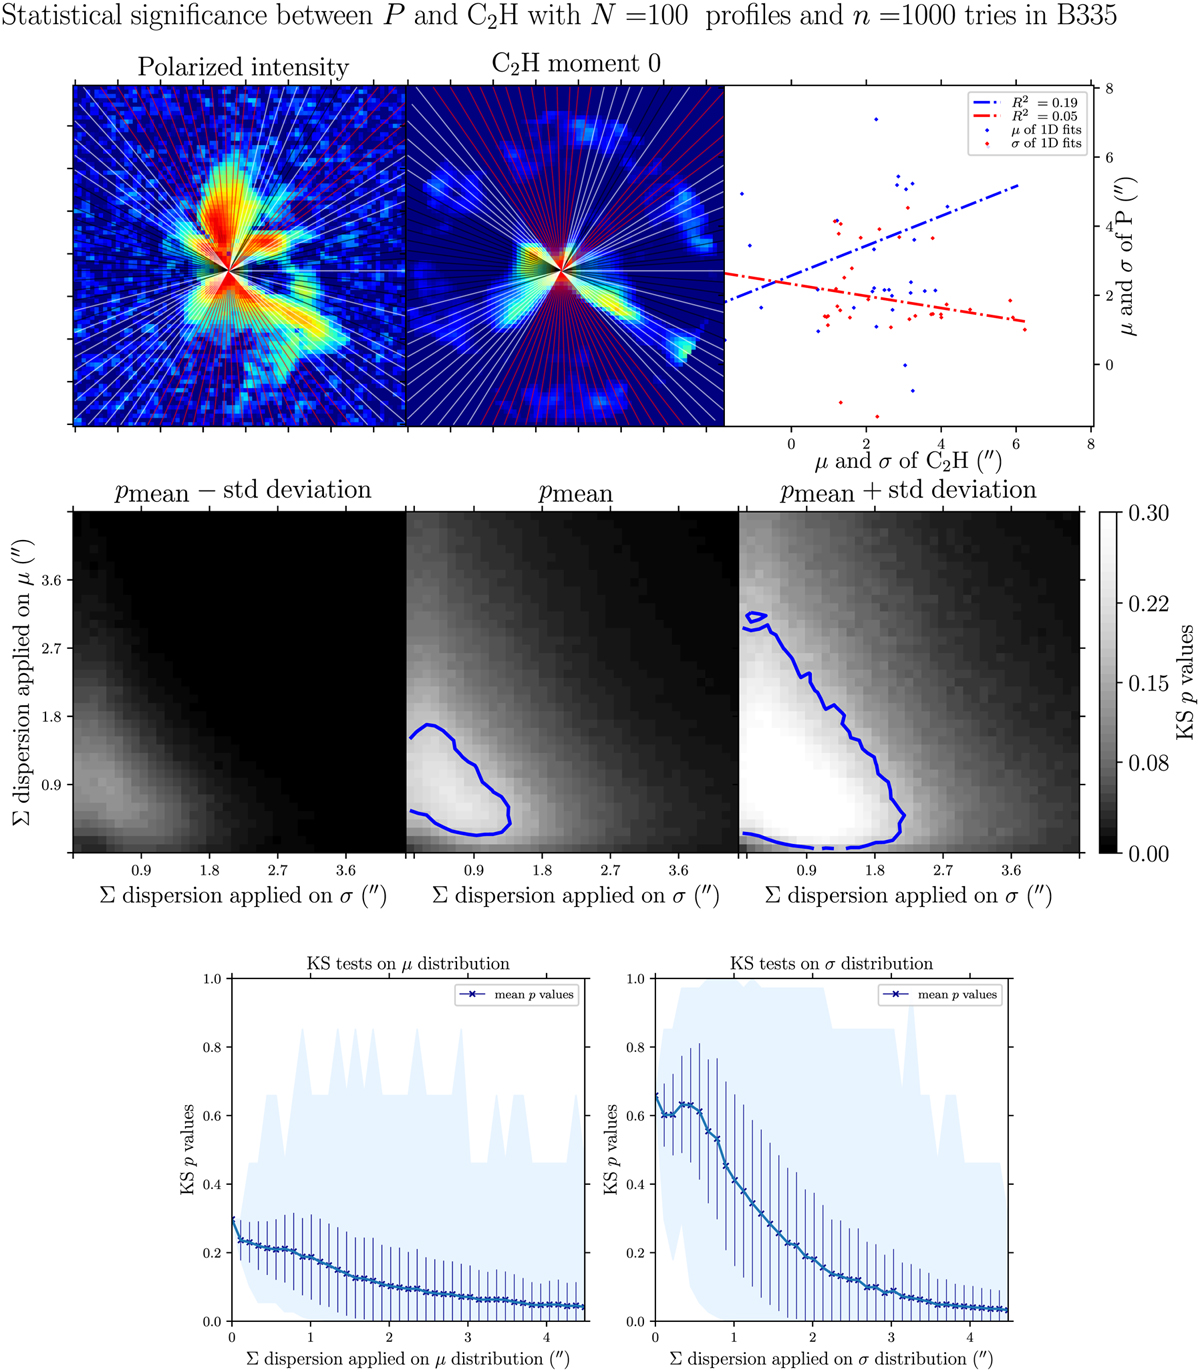
Fig. 7
Download original image
Results from the two-sided 1D and 2D KS tests between the P and C2H moment 0 maps of B335, performed with N = 100 and n = 1000. Top row (left and middle): P and C2H moment 0 emission maps in color scale, respectively. Both maps are overlaid with the N lines, where the white lines correspond to the N′ sample of selected profiles. The red lines correspond to the profiles where the S/N selection criteria was not reached, and the black lines correspond to the profiles where the 1D Gaussian fit does not converge. Right: obtained (σ,µ) values from these 1D Gaussian fits in the form of a 2D diagram, with a linear regression line fitting both the σ and µ values. Middle row: results of the two-sided 2D KS tests, where each pixel corresponds to a given Gaussian distribution of width Σ, added on the sample of σ values (x-axis) and µ values (y-axis), obtained from the P map. The gray scale corresponds to the p-values obtained after n realizations. The left, middle, and right panels, show the mean p-value minus the standard deviation of p-values, the mean p-value, and the mean p-value plus the standard deviation of the obtained p-values, respectively. The blue contours correspond to p = 0.2. Bottom row: results of the two-sided 1D KS tests performed on the µ values (left panel) and on the σ values (right panel). In each panel the solid line and markers represent the resulting mean p-value as a function of Σ, which is the width of the Gaussian distribution added on the σ and µ values obtained from the P map. At each point, the shaded area shows the complete range of obtained p-values, while the error bars indicate the standard deviation of the distribution of p-values after n tries. Given our p rejection criteria of 0.2, we can infer that the two (σ,µ) distributions between the C2H moment 0 and P maps could come from a common parent distribution.
Current usage metrics show cumulative count of Article Views (full-text article views including HTML views, PDF and ePub downloads, according to the available data) and Abstracts Views on Vision4Press platform.
Data correspond to usage on the plateform after 2015. The current usage metrics is available 48-96 hours after online publication and is updated daily on week days.
Initial download of the metrics may take a while.