Fig. 1
Download original image
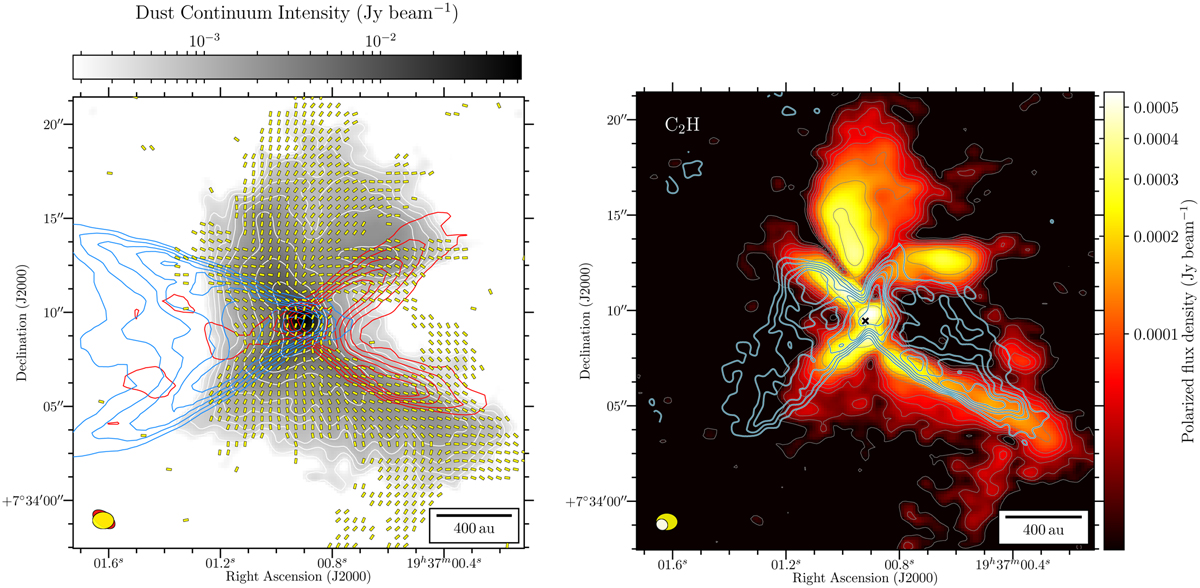
Observations of magnetic fields, polarized intensity, and molecular lines around the B335 Class 0 protostellar core. Left panel: line segments represent magnetic field lines, rotated by 90° from the dust polarization angle (the length of a segment does not represent a quantity). They are plotted where the polarized intensity P > 3σP. The gray scale is the total intensity (Stokes I) of the thermal dust emission, shown from 3σI. The white contours trace the total intensity at levels of 5, 8, 11, 16, 24, 44, 74, 128, 256 × σI. The blue and red contours trace the moment 0 map of the blueshifted (by integrating emission from −25 to 7 km s−1) and redshifted (by integrating emission from 10 to 35 km s−1) CO (J = 2 → 1) map at levels of 3, 5, 7, 9, 11, 16, 24, 44, 74, 128, 256, 400 × the rms noise level of the map. Right panel: in each panel the color scale is the dust polarization intensity, shown from 3σP. The crosses indicate the peak of the dust continuum map. The thin gray contours trace the dust polarization intensity, at levels of 3, 5, 7, 9, 11, 16, 24, 44 × σP. The thick light blue contours trace the moment 0 map of the C2H (by integrating emission from 7 to 12.5 km s−1) molecular emission spectral line (see Table 2 for details of the line transitions) at levels of 3, 5, 7, 9, 11, 16, 24, 44 × the rms noise level of each map. In the bottom left corner of each panel the ellipses represent the beam resolution element of a given dataset: yellow for polarized dust emission, red for CO bipolar outflow emission, and white for the CCH spectral emission line. The ALMA 1.3mm dust polarized emission is from Maury et al. (2018, and in prep.). The ALMA CO (J = 2 → 1) bipolar outflow emission is from Cabedo et al. (2021). The C2H emission line is from Imai et al. (2016).
Current usage metrics show cumulative count of Article Views (full-text article views including HTML views, PDF and ePub downloads, according to the available data) and Abstracts Views on Vision4Press platform.
Data correspond to usage on the plateform after 2015. The current usage metrics is available 48-96 hours after online publication and is updated daily on week days.
Initial download of the metrics may take a while.