| Issue |
A&A
Volume 698, June 2025
|
|
|---|---|---|
| Article Number | L16 | |
| Number of page(s) | 8 | |
| Section | Letters to the Editor | |
| DOI | https://doi.org/10.1051/0004-6361/202554750 | |
| Published online | 12 June 2025 | |
Letter to the Editor
FAUST
XXIV. Large dust grains in the protostellar outflow cavity walls of the Class I binary L1551 IRS5
1
INAF, Osservatorio Astrofisico di Arcetri, Largo E. Fermi 5, I-50125 Firenze, Italy
2
National Radio Astronomy Observatory, PO Box O Socorro, NM 87801, USA
3
European Southern Observatory, Alonso de Cordova 3107, Vitacura, Region Metropolitana de Santiago, Chile
4
Center for Astrochemical Studies, Max-Planck-Institut für Extraterrestrische Physik, Gießenbachstr. 1, 85748 Garching, Germany
5
Univ. Grenoble Alpes, CNRS, IPAG, 38000 Grenoble, France
6
RIKEN Cluster for Pioneering Research, 2-1, Hirosawa, Wako-shi, Saitama 351-0198, Japan
7
Dipartimento di Fisica e Astronomia “Augusto Righi”, Viale Berti Pichat 6/2, Bologna, Italy
8
European Southern Observatory, Karl-Schwarzschild-Strasse 2, D-85748 Garching bei München, Germany
9
Graduate School of Informatics and Engineering, The University of Electro-Communications, Chofu, Tokyo 182-8585, Japan
10
Leiden Observatory, Leiden University, PO Box 9513 2300 RA Leiden, The Netherlands
11
Centro de Astrobiología (CSIC-INTA), Ctra. de Torrejón a Ajalvir, km 4, 28850 Torrejón de Ardoz, Spain
12
NRC Herzberg Astronomy and Astrophysics, 5071 West Saanich Rd, Victoria, BC V9E 2E7, Canada
13
Department of Physics and Astronomy, University of Victoria, Victoria, BC V8P 5C2, Canada
14
Instituto de Radioastronomía y Astrofísica, UNAM, Apartado Postal 3-72, Morelia, 58090 Michoacán, Mexico
15
Black Hole Initiative at Harvard University, 20 Garden Street, Cambridge, MA 02138, USA
16
David Rockefeller Center for Latin American Studies, Harvard University, 1730 Cambridge Street, Cambridge, MA 02138, USA
17
Star and Planet Formation Laboratory, RIKEN Cluster for Pioneering Research, Wako, Saitama 351-0198, Japan
18
SOKENDAI (The Graduate University for Advanced Studies), Shonan Village, Hayama, Kanagawa 240-0193, Japan
⋆ Corresponding author: This email address is being protected from spambots. You need JavaScript enabled to view it.
Received:
25
March
2025
Accepted:
15
May
2025
Abstract
Context. Planet formation around young stars requires the growth of interstellar dust grains from micron-sized (μm-sized) particles to kilometre-sized (km-sized) planetesimals. Numerical simulations have shown that large (mm-sized) grains found in the inner envelope of young protostars could be lifted from the disc via winds. However, we are still lacking unambiguous evidence for large grains in protostellar winds and outflows.
Aims. We investigated dust continuum emission in the envelope of the Class I binary L1551 IRS5 in the Taurus molecular cloud, aiming to identify observational signatures of grain growth, such as variations in the dust emissivity index (βmm).
Methods. In this context, we present new, high-angular resolution (50 au) observations of thermal dust continuum emission at 1.3 mm and 3 mm in the envelope (∼3000 au) of L1551 IRS5, obtained as part of the ALMA-FAUST Large Program.
Results. We analysed dust emission along the cavity walls of the CO outflow, extended up to ∼1800 au. We found an H2 volume density > 2 × 105 cm−3, a dust mass of ∼58 M⊕, and βmm ≲ 1, implying the presence of grains ∼103 times larger than typical sizes for the interstellar medium (ISM).
Conclusions. We present the first spatially resolved observational evidence of large grains within an outflow cavity wall. Our results suggest that these grains have been transported from the inner disc to the envelope by protostellar winds and may subsequently fall back into the outer disc by gravity and/or via accretion streamers. This cycle provides longer time for grains to grow, demonstrating their crucial role in the formation of planetesimals.
Key words: planets and satellites: formation / circumstellar matter / stars: formation / stars: low-mass / stars: winds / outflows / dust / extinction
© The Authors 2025
 Open Access article, published by EDP Sciences, under the terms of the Creative Commons Attribution License (https://creativecommons.org/licenses/by/4.0), which permits unrestricted use, distribution, and reproduction in any medium, provided the original work is properly cited.
This article is published in open access under the Subscribe to Open model. This email address is being protected from spambots. You need JavaScript enabled to view it. to support open access publication.
1. Introduction
The formation of terrestrial planets and rocky cores of giant planets is a complex process harboured inside protoplanetary discs surrounding young stellar objects (YSOs). This process begins with sub-micron-sized dust grains – typically from 0.01 to 0.3 μm in the diffuse interstellar medium (ISM; Mathis et al. 1977) and up to 1 μm in dense molecular clouds (Dartois et al. 2024) – and culminates in the disc, with the formation of dust pebbles, planetesimals, and planets that may harbour life (e.g. Testi et al. 2014; Drążkowska et al. 2023; Birnstiel 2024).
The Atacama Large Millimeter/submillimeter Array (ALMA) has enabled significant progress in understanding the initial conditions of planet formation. ALMA observations have demonstrated that dust grains in protoplanetary discs can reach millimeter and centimeter sizes (mm-cm; e.g. Testi et al. 2014; Liu et al. 2021; Macías et al. 2021; Radley et al. 2025), consistent with predictions from dust growth and evolution models (e.g. Birnstiel et al. 2012). However, a major hurdle arises when considering the fate of larger (≳mm-sized) grains in protoplanetary discs. Models predict that the dust experiences drag forces due to the different velocities between the dust grains and the gas in the disc, causing the mm- and cm-sized dust grain to progressively spiral inwards towards the central YSO, with the fastest velocity associated with the grains marginally coupled to the gas. These grains have Stokes numbers close to unity and their sizes range between 1 mm and 1 m for typical disc parameters (e.g. Weidenschilling 1977; Laibe et al. 2012). This migration is also supported by observations, showing that large grains are concentrated toward the centre of Class II discs (e.g. Carrasco-González et al. 2019; Tazzari et al. 2021). The so-called ‘radial drift’ of large grains occurs on timescales much shorter (e.g. Laibe et al. 2012) than the disc lifetime (a few Myr; Ribas et al. 2015), posing a major challenge to the theory of planet formation.
More recent observations suggest that dust growth up to mm sizes could begin in collapsing inner protostellar envelopes (∼500 au), much earlier and further away from the host stars than previously thought (e.g. Miotello et al. 2014; Galametz et al. 2019; Bouvier et al. 2021). Despite numerical simulations predict inefficient dust growth at the typical densities of collapsing protostellar envelopes (∼105 cm−3; e.g. Guillet et al. 2020; Bate 2022), other studies suggest that large grains from the inner disc, where the dust growth is efficient due to the large density, could be transported into the envelope via magnetohydrodynamic (MHD) winds (e.g. Giacalone et al. 2019; Tsukamoto et al. 2021). This scenario is supported by the anti-correlation between the dust spectral index and the jet mass-loss rate observed in Class 0 protostars (Cacciapuoti et al. 2024a). Previous results from the ALMA Large Program (LP) ‘Fifty AU STudy of the chemistry in the disc-envelope system of Solar-like protostars’ (FAUST)1 suggested the presence of dust-rich cavity walls associated with the outflow driven by the Class 0/I IRS7B system in the Corona Australis cluster (Sabatini et al. 2024). However, the detection of emission in these structures only at ∼1.3 mm hampered the estimate of the dust emissivity index (βmm; which is anti-correlated with the max grain size) to test the scenario of dust wind transport.
This Letter presents the first direct evidence of large dust grains in the cavity wall of spatially resolved protostellar outflows, based on new ALMA continuum observations at 1.3 and 3 mm towards L1551 IRS5 obtained as part of FAUST LP.
L1551 IRS5 is a Class I binary system in the Taurus star-forming region. The two protostars, separated by 50 au, have a total mass of 1 M⊙ (Rodríguez et al. 1998; Hernández Garnica et al. 2024). Both protostars drive jets (Rodríguez et al. 2003; Feeney-Johansson et al. 2023) and harbour hot corino chemistry (Bianchi et al. 2020; Cruz-Sáenz de Miera et al. 2025). The binaries are surrounded by a circumbinary disc with a radius of ∼140 au and a total mass of ∼0.02−0.03 M⊙ (e.g. Takakuwa et al. 2020; Kóspál et al. 2021). The source has been classified as an FU Orionis-like object (Connelley & Reipurth 2018) and has a total bolometric luminosity Lbol ∼ 27 L⊙ (for a distance of 147 pc; Green et al. 2013). The structure and kinematics of the large-scale envelope has been extensively investigated (e.g. Osorio et al. 2003). This makes L1551 IRS5 an excellent candidate to investigate the dust growth process from small to envelope scales, exploiting multi-scale and multi-wavelengths high-sensitivity observations of ALMA-FAUST.
2. Observations and data reduction
We observed the L1551 IRS5 system with ALMA between October 2018 and August 2019 as part of the FAUST LP (2018.1.01205.L; PI: S. Yamamoto). These observations achieved a native angular resolution of 0 4 × 0
4 × 0 3; ∼52 au at the source distance of 147 ± 5 pc (Connelley & Reipurth 2018), and a maximum recoverable scale of ∼21″ (∼3100 au). In this Letter, we present data obtained in two spectral setups: Band 3 (85−101 GHz) and Band 6 (214−234 GHz), using both the 12-m array and the Atacama Compact Array (ACA; Band 6 only; see Appendix A).
All observations were made with a water vapour ≲3.0 mm and centred on  ,
,  . Data calibration was performed using a modified version of the CASA pipeline (v5.6.1-8; The CASA Team 2022), including additional routines to correct for Tsys and spectral normalisation issues2. The data were self-calibrated using line-free channels, improving the dynamic range of the maps by a factor of ∼5. The final continuum maps were cleaned using deconvolver = ‘mtmfs’ (nterms = 2) and natural weighting, a common uv-range in both bands (inner uv-cutoff: uvrange = ‘> 10klambda’) and a restoring beam of
  . The typical rms noise in the maps is ∼0.05 mJy beam−1 (B6; 1.3 mm) and ∼0.04 mJy beam−1 (B3; 3.0 mm). The absolute flux uncertainty is found to be < 10%. The primary beam (PB) correction was applied to all the images.
3. Results
Figure 1 shows the distribution of the dust continuum emission at 3.0 and 1.3 mm toward L1551 IRS5. To improve the signal-to-noise ratio, both maps have been smoothed to  angular resolution. The two circumstellar discs, L1551 IRS5-N and IRS5-S, and their circumbinary disc are shown at the center of the field.
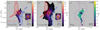 |
Fig. 1. L1551 IRS5 Class I binary system. (a, b) FAUST maps at 1.3 and 3.0 mm, at the resolution of |

The ALMA continuum emission at both wavelengths also reveals an elongated structure extending towards the south. This structure is detected above the 6σ level up to ∼1300 au (in B3) and ∼1800 au (in B6) from L1551 IRS5. A second, fainter and less extended counterpart is detected toward the north, visible only at 1.3 mm. Comparison with red- and blue-shifted CO(2−1) emission (2016.1.00209.S; Cruz-Sáenz de Miera et al. 2019) indicates that these continuum structures trace the edges of the cavities opened by the blue- (south-west) and red-shifted (north-east) lobes of the outflow driven by L1551 IRS5, with a wide opening angle of ∼90° (e.g. Wu et al. 2009).
3.1. Physical properties of the dusty cavity walls
To calculate the mass budget and H2 column density associated with the observed dusty cavity walls, we assume that the thermal balance of the L1551 IRS5 envelope is dominated by central heating from the accreting protostars. We can therefore derive a map of dust temperature (Tdust), following Motte & André (2001) and Jørgensen et al. (2002), where Tdust(r) = 38 K × (Lbol/L⊙)0.2 × (r/100 au)−0.4. The dust temperature along the cavity wall ranges from ∼25 to ∼50 K. The continuum opacity can then be computed as τ = −ln[1 − Iν/Bν(Tdust)], where Iν is the observed specific intensity and Bν(Tdust) is the Planck function at Tdust. The τ derived at 1.3 and 3.0 mm are always ≲0.20, implying optically thin emission (Fig. B.1).
To derive the mass of dust along the cavity walls, Mdust, and the gas column density, N(H2), we assumed Tdust = 30 K, corresponding to the median value along the cavity walls, and a dust opacity at 1.3 mm, κ1.3 mm = 0.9 cm2 g−1, appropriate for icy-mantled dust grains at a density of ∼106 cm−3 (Ossenkopf & Henning 1994), which is a reasonable assumption in the cold dusty cavities. From an integrated intensity of 55 mJy along the southern cavity wall, we infer a mass of dust in the cavity of Mdust ∼ 58 M⊕. This corresponds to ∼40% of the total dust mass in the L1551 IRS5 system, namely, in the circumstellar discs (N and S) and the circumbinary disc surrounding them (∼140 M⊕, Cruz-Sáenz de Miera et al. 2019). Assuming a dust-to-gas ratio of 100, we infer a total N(H2) ∼ 3.6 × 1021 cm−2 over the structure, reaching its peak of ∼7.1 × 1020 cm−2 at the location corresponding to the maximum intensity along the cavity wall ( ∼ 11 mJy beam−1). Assuming that the length of the cavity wall along the line of sight is equal to its width in B3, ∼250 au, we estimated a lower limit of the average H2 volume density along the cavity walls of n(H2) > 2 × 105 cm−3. Finally, we note that the temperature in the outflow cavities may be a factor of 1.2 − 1.5 higher than what estimated in this section if there is an additional source of heating due to UV irradiation and/or slow shocks (e.g. Visser et al. 2012; Lee et al. 2015). Considering this temperature variation and assuming an intrinsic uncertainty of ∼20% for the assumed gas-to-dust ratio (Sanhueza et al. 2017), depending on grain size, shape, and composition along the cavity wall, the resulting masses and densities may be reduced by ∼25−40% compared to those estimated assuming 30 K.
3.2. Dust spectral index in the dusty cavity walls
To constrain the maximum size of the grains emitting along the cavity walls, we used the maps of continuum emission in ALMA B3 and B6 (see Fig. 1) to obtain a map of the slope (αmm) of the mm spectral energy distribution (SED; Fν ∝ ναmm), as:
 (1)
(1)
where F(νB3) and F(νB6) are the PB-corrected fluxes in B3 and B6, respectively, while νB3 = 100.6 GHz and νB6 = 225.4 GHz are the representative frequencies of the two ALMA bands. The PB correction (Sect. 2) along the cavity walls leads to an increase in the observed flux by a factor of < 1.3 in B6 and < 1.1 in B3.
Figure 1 shows the variation of αmm where emission at both bands is detected with a signal-to-noise ratio > 3, corresponding to the region delimitated by the white contours. The corresponding absolute error, δ(αmm), was obtained via standard error propagation including the system calibration uncertainties (5% in B3 and 10% in B6; Cortes et al. 2022) and the uncertainties on the observed ALMA fluxes (see Fig. B2). We find a mean ⟨αmm⟩ = 2.68 ± 0.26 in the cavity wall, with values ranging from 2.06 to 3.04 (corresponding to the 5th and 95th percentiles of the αmm distribution). These values are consistent across the entire structure and no clear variation is observed for αmm at different positions along the cavity wall. It is worth noting that thermal free-free contamination is not expected to be relevant at mm wavelengths. To the best of our knowledge, the only available estimate of free-free contamination in a cavity wall is for a distance of ∼400 au from the source Serpens SMM1. This intermediate-mass Class 0 protostar is associated with a powerful free-free radio jet. The estimate indicates a free-free contribution of ∼15% at 7 mm in the cavity, which would decrease to less than 1% at 3 mm (Hull et al. 2016). Nevertheless, future analysis based on cm-wavelengths will provide direct constrains on the fraction of free-free contamination in the L1551 IRS5 cavity walls.
In Sect. 3.1, we find that dust emission is optically thin at both wavelengths and that the Rayleigh-Jeans approximation (hν/kBT ≪ 1) is always valid for the derived Tdust, which is in the range 25−50 K. Therefore, the slope of the dust opacity power-law κν ∝ νβmm, does not depend on Tdust and can be derived as βmm = αmm − 2, where βmm is connected with the maximum grain sizes of the dust population (Draine 2006; Ricci et al. 2010; Testi et al. 2014). To investigate the variation of grain properties along the cavity walls, we evaluate the dust temperature, brightness temperature (Tb), continuum opacity, αmm, and βmm in circular regions, with equivalent area of three resolution beams, at specific locations along the blue- and red-shifted cavities. These positions correspond to the blue and red crosses in Figure B.1, respectively. The obtained profiles of Tdust, Tb, τ, αmm and βmm are shown in Appendix C and Figure C1, where the lower-limits on αmm and βmm are estimated assuming a 3σ upper-limit at 3.0 mm. The bottom panels of Figure C1 show that along the cavity walls βmm ≲ 1, well below the typical value of βISM ∼ 1.6 (Schwartz 1982; Planck Collaboration Int. XIV 2014). Regardless of the chemical composition, porosity, and icy-coverage of the grains, values of βmm < 1 (for optically thin emission) indicate grains larger than those typically observed in the ISM (Testi et al. 2014; Ysard et al. 2019).
4. Discussion
The dust emissivity index is sensitive to dust composition, porosity, and the presence or absence of icy mantles (Testi et al. 2014). While variations in βmm reflect differing grain properties, values below ∼1 (such as those derived in the previous section) provide strong evidence for the presence of (sub)mm-sized grains within the observed distribution (Draine 2006; Köhler et al. 2015; Ysard et al. 2019). Although further laboratory studies are required to better constrain the relationship between βmm and dust properties, the presence of grains significantly larger than typical ISM sizes remains the most compelling explanation for our results. This result may provide an additional explanation for the low βmm derived at envelope scales towards some Class 0/I sources (e.g. Kwon et al. 2009; Miotello et al. 2014; Chen et al. 2016; Galametz et al. 2019; Bouvier et al. 2021). In this context, we have considered two scenarios. In the first, the dust growth and coagulation occurring in situ within the outflow cavity walls produces, on envelope scales, grains larger than those typically observed in the ISM. In the second, large grains grow in the protostellar disc and are entrained into the envelope by outflows and/or winds.
The first hypothesis could be explained by the compression of envelope material and the resulting local increase in gas and dust density at the edge of the cavity. Simulations of dust evolution in collapsing protostellar envelopes have shown that given the typical densities of these environments (∼105 cm−3), grains can grow only up to a few microns (e.g. Hirashita & Omukai 2009; Bate 2022; Lebreuilly et al. 2023). Silsbee et al. (2022) recently showed that when starting with an initial grain size of 1 μm, it is only when local gas densities are > 107 cm−3 that the growth timescale required to form mm-sized grains becomes shorter than the estimated lifetime of L1551 IRS5 (∼105 yr; Fridlund et al. 2002). Therefore, local in situ grain growth may potentially play a role only in specific over-densities along the walls, where n(H2) is about two orders of magnitude higher than the lower-limit, n(H2) > 2 × 105 cm−3, as estimated in Sect. 3.1.
The second possibility is to consider that the grains are grown in the protostellar discs and are subsequently entrained into the envelope by outflows and winds. Duchêne et al. (2024) found evidence for grains up to ≳10 μm in size in the upper layers of the protoplanetary disc around the young star J04202144+2813491, using observations from the James Webb Space Telescope (JWST). These grains are significantly larger (3 to 103 times) than typical maximum grain sizes (amax) in the diffuse ISM and in dense molecular clouds (e.g. Weingartner & Draine 2001). The authors proposed that these particles, fully coupled to the gas, are entrained into the upper layers by photoevaporating disc winds. However, mm-sized grains are expected to be moderately settled in the mid-plane of Class I discs (Villenave et al. 2023). Nevertheless, laboratory experiments have shown that the sticking properties of dry dust grains increase by a factor of ∼100 when the temperature reaches ∼1000−1300 K (Bogdan et al. 2020; Pillich et al. 2021). This strongly supports the potential presence of large grains in the inner disc regions, close to the launching point of the winds. Models of dust growth and evolution predict a radial distribution of grain sizes, with the largest grains located closer to the protostar (e.g. Garaud 2007; Birnstiel et al. 2010). Notably, the presence of dust particles with sizes larger than ≳1 mm has been inferred in the inner ∼10−20 au of Class II protoplanetary discs (e.g. Pérez et al. 2012, 2015; Sierra et al. 2021) and in the source FU Ori (e.g. Liu et al. 2021).
Recent solutions of MHD winds models have shown that grains can be lifted from the disc to the envelope (e.g. Giacalone et al. 2019; Tsukamoto et al. 2021; Bhandare et al. 2024). In particular, Giacalone et al. (2019) derived amax, which can be entrained into the envelope following a simplified equation3,
 (2)
(2)
Based on Eq. (2), amax is proportional to the mass-loss rate, Ṁ, the gas temperature, Tgas, and the stellar mass, M*. For L1551 IRS5, we assumed M* = 1 M⊙ (Sect. 1), Tgas = 100 K as the fiducial value for the gas temperature in protostellar jets (e.g. Podio et al. 2021), Ṁ ∼ (1−5) × 10−5 M⊙ yr−1 estimated from molecular emission (Fridlund et al. 2002). We obtained amax ∼ [0.2 − 0.9] mm, depending on the assumed Ṁ. These values are up to three orders of magnitude larger than the typical ISM values and are aligned with the calculated βmm ∼ 0.7 (Sect. 3.2; e.g. Testi et al. 2014; Ysard et al. 2019). Furthermore, L1551 IRS5, classified as a FU Ori object, may have experienced outbursts with significantly larger accretion and mass-loss rates. Assuming the grains survive the intense radiation field without sublimating (Chau Giang et al. 2025), at these high Ṁ values, even large grains (sizes > 1 mm) at the base of the outflow (< 1 au; Bourdarot et al. 2023) can be entrained by the winds and populate the observed dusty cavity walls. This scenario is supported by the anti-correlation between βmm and the jet mass-loss rate for the CALYPSO sample of Class 0 protostars (e.g. Galametz et al. 2019; Cacciapuoti et al. 2024a). In this context, higher-angular resolution observations would be crucial to distinguish between these two scenarios. If large grains are transported from the inner disc by MHD winds, we would expect lower βmm values near the wind or jet launching point, where large grains are entrained from the disc. Moving outward from the protostar, βmm should increase, eventually reaching the typical ISM value. Conversely, if in situ dust growth or coagulation occurs along the dusty cavity walls, we would expect lower βmm values at the positions of local overdensities along the walls.
Regardless of the physical mechanism behind the observed low βmm, we can speculate that large grains along the cavity walls may subsequently fall back onto the protostellar disc due to gravity, as predicted by Tsukamoto et al. (2021), allowing grains to further grow up to the necessary limit to overcome the radial drift barrier. This scenario also provide a possible explanation for the observed isotopic anomalies in Solar System meteorites, namely, the presence of refractory inclusions in chondrites, such as calcium-aluminium-rich inclusions (CAIs) and amoeboid olivine aggregates (AOAs). These inclusions are considered to be key pieces of evidence to support the presence of primordial dust in the solar protoplanetary disc, representing high-temperature condensates formed near the proto-sun, before being transported to the outer disc (e.g. Morbidelli et al. 2024).
5. Conclusions
The analysis of dust continuum emission at 1.3 and 3 mm, obtained in the context of ALMA-FAUST LP, allows us to derive the spatially resolved dust spectral index in the cavity walls of the outflow associated with the L1551 IRS5 binary system. The low inferred value (βmm < 1) strongly suggests, for the first time, the presence of mm-sized dust grains along the protostellar outflow cavities.
This new result may explain previous evidence of large grains at envelope scales in Class 0/I sources (e.g. Kwon et al. 2009; Miotello et al. 2014; Galametz et al. 2019). More specifically, grains can grow in protostellar discs and then be lifted in the envelope by outflow and/or winds (e.g. Giacalone et al. 2019; Bhandare et al. 2024; Cacciapuoti et al. 2024a). In light of these results, we also speculate that large grains may successively fall back in the outer disc due to gravity (Tsukamoto et al. 2021) and/or transportation along accretion streamers (Cacciapuoti et al. 2024b). This would provide additional time for grains to grow overcoming the long-standing problem of pebble formation in discs (e.g. Drążkowska et al. 2023; Birnstiel 2024).
This study underscores the importance of complementing disc observations with high-sensitivity intermediate- to large-scale observations to investigate the dust growth process in young protostellar environments. It appears now crucial to expand our pilot study to a larger sample of sources associated with powerful outflows to detect dusty cavity walls and quantify the role of outflows and winds in the grain growth process. Additional evidence may also come from polarisation studies at comparable spatial scales (e.g. Hull et al. 2020).
Future astronomical facilities, such as the next-generation Very Large Array (ngVLA)4 and the Square Kilometre Array Observatory (SKAO)5, may represent a significant step forward in characterising dusty cavity walls. These facilities will extend high sensitivity and angular resolution observations to radio wavelengths, providing crucial constraints on the physics of dust growth during stars and planets formation process.
Equation (2) assumes an outflow’s launching footpoint r = 1 au, a disc flaring ratio of z/r = 0.1, and a ratio between the disc’s outer and inner edge of r+/r− = 500 (i.e. typical disc of 50 au and inner edge of 0.1 au). We refer to Giacalone et al. (2019) for more details.
Official ngVLA webpage: https://ngvla.nrao.edu/
Official SKAO webpage: https://www.skao.int/en
ALMA is a partnership of the ESO (representing its member states), the NSF (USA) NINS (Japan), the NRC (Canada), the NSC and ASIAA (Taiwan) in cooperation with the Republic of Chile. The JAO is operated by the ESO, the AUI/NRAO, and the NAOJ.
Acknowledgments
The authors thank the anonymous referee for her/his suggestions to improve the manuscript. This Letter makes use of the following ALMA data: ADS/JAO.ALMA#2018.1.01205.L (PI: S. Yamamoto). GS, LP and CC acknowledge the project PRIN-MUR 2020 MUR BEYOND-2p (Prot. 2020AFB3FX), the PRIN MUR 2022 FOSSILS (Chemical origins: linking the fossil composition of the Solar System with the chemistry of protoplanetary disks, Prot. 2022JC2Y93), the project ASI-Astrobiologia 2023 MIGLIORA (F83C23000800005), and the INAF-GO 2023 fundings PROTO-SKA (C13C23000770005). GS thanks the INAF-Minigrant 2023 TRIESTE (PI: G. Sabatini). NC acknowledges the financial support from the ERC under the European Union Horizon Europe programme (g.a. No. 101042275; Stellar-MADE). LP acknowledges the INAF Mini-Grant 2022 “Chemical Origins” (PI: L. Podio). EB is supported by the Next Generation EU funds within the National Recovery and Resilience Plan (PNRR), Mission 4 – Education and Research, Component 2 – From Research to Business (M4C2), Investment Line 3.1 – Strengthening and creation of Research Infrastructures, Project IR0000034 – “STILES – Strengthening the Italian Leadership in ELT and SKA”. MB acknowledges support from the ERC Advanced Grant MOPPEX 833460. LL acknowledges the support of DGAPA PAPIIT grants IN108324 and IN112820 and CONACyT-CF grant 263356. IJ-S acknowledges funding from grants No. PID2019-105552RB-C41 and PID2022-136814NB-I00 from the Spanish Ministry of Science and Innovation/State Agency of Research MCIN/AEI/10.13039/501100011033 and by “ERDF A way of making Europe”. DJ is supported by NRC Canada and by an NSERC Discovery Grant. LL acknowledges the support of UNAM-DGAPA PAPIIT grants IN108324 and IN112820 and CONACYT-CF grant 263356.
References
- Bate, M. R. 2022, MNRAS, 514, 2145 [CrossRef] [Google Scholar]
- Bhandare, A., Commerçon, B., Laibe, G., et al. 2024, A&A, 687, A158 [NASA ADS] [CrossRef] [EDP Sciences] [Google Scholar]
- Bianchi, E., Chandler, C. J., Ceccarelli, C., et al. 2020, MNRAS, 498, L87 [NASA ADS] [CrossRef] [Google Scholar]
- Birnstiel, T. 2024, ARA&A, 62, 157 [NASA ADS] [CrossRef] [Google Scholar]
- Birnstiel, T., Ricci, L., Trotta, F., et al. 2010, A&A, 516, L14 [NASA ADS] [CrossRef] [EDP Sciences] [Google Scholar]
- Birnstiel, T., Klahr, H., & Ercolano, B. 2012, A&A, 539, A148 [NASA ADS] [CrossRef] [EDP Sciences] [Google Scholar]
- Bogdan, T., Pillich, C., Landers, J., Wende, H., & Wurm, G. 2020, A&A, 638, A151 [EDP Sciences] [Google Scholar]
- Bourdarot, G., Berger, J. P., Lesur, G., et al. 2023, A&A, 676, A124 [NASA ADS] [CrossRef] [EDP Sciences] [Google Scholar]
- Bouvier, M., López-Sepulcre, A., Ceccarelli, C., et al. 2021, A&A, 653, A117 [CrossRef] [EDP Sciences] [Google Scholar]
- Cacciapuoti, L., Testi, L., Podio, L., et al. 2024a, ApJ, 961, 90 [NASA ADS] [CrossRef] [Google Scholar]
- Cacciapuoti, L., Macias, E., Gupta, A., et al. 2024b, A&A, 682, A61 [NASA ADS] [CrossRef] [EDP Sciences] [Google Scholar]
- Carrasco-González, C., Sierra, A., Flock, M., et al. 2019, ApJ, 883, 71 [Google Scholar]
- Chau Giang, N., Le Gouellec, V. J. M., Hoang, T., Maury, A. J., & Hennebelle, P. 2025, ArXiv e-prints [arXiv:2501.12026] [Google Scholar]
- Chen, M. C.-Y., Di Francesco, J., Johnstone, D., et al. 2016, ApJ, 826, 95 [NASA ADS] [CrossRef] [Google Scholar]
- Codella, C., Ceccarelli, C., Chandler, C., et al. 2021, FSPAS, 8, 227 [Google Scholar]
- Connelley, M. S., & Reipurth, B. 2018, ApJ, 861, 145 [NASA ADS] [CrossRef] [Google Scholar]
- Cortes, P., Remijan, A., Hales, A., et al. 2022, ALMA Cycle 9 Techn. Handbook [Google Scholar]
- Cruz-Sáenz de Miera, F., Kóspál, Á., Ábrahám, P., Liu, H. B., & Takami, M. 2019, ApJ, 882, L4 [CrossRef] [Google Scholar]
- Cruz-Sáenz de Miera, F., Coutens, A., Kóspál, Á., et al. 2025, A&A, 696, A18 [NASA ADS] [CrossRef] [EDP Sciences] [Google Scholar]
- Dartois, E., Noble, J. A., Caselli, P., et al. 2024, Nat. Astron., 8, 359 [NASA ADS] [CrossRef] [Google Scholar]
- Draine, B. T. 2006, ApJ, 636, 1114 [Google Scholar]
- Drążkowska, J., Bitsch, B., Lambrechts, M., et al. 2023, ASP Conf. Ser., 534, 717 [NASA ADS] [Google Scholar]
- Duchêne, G., Ménard, F., Stapelfeldt, K. R., et al. 2024, AJ, 167, 77 [CrossRef] [Google Scholar]
- Feeney-Johansson, A., Purser, S. J. D., Ray, T. P., et al. 2023, A&A, 677, A97 [NASA ADS] [CrossRef] [EDP Sciences] [Google Scholar]
- Fridlund, C. V. M., Bergman, P., White, G. J., Pilbratt, G. L., & Tauber, J. A. 2002, A&A, 382, 573 [NASA ADS] [CrossRef] [EDP Sciences] [Google Scholar]
- Galametz, M., Maury, A. J., Valdivia, V., et al. 2019, A&A, 632, A5 [NASA ADS] [CrossRef] [EDP Sciences] [Google Scholar]
- Garaud, P. 2007, ApJ, 671, 2091 [NASA ADS] [CrossRef] [Google Scholar]
- Giacalone, S., Teitler, S., Königl, A., Krijt, S., & Ciesla, F. J. 2019, ApJ, 882, 33 [NASA ADS] [CrossRef] [Google Scholar]
- Green, J. D., Evans, N. J., II, Jørgensen, J. K., et al. 2013, ApJ, 770, 123 [Google Scholar]
- Guidi, G., Isella, A., Testi, L., et al. 2022, A&A, 664, A137 [NASA ADS] [CrossRef] [EDP Sciences] [Google Scholar]
- Guillet, V., Hennebelle, P., Pineau des Forêts, G., et al. 2020, A&A, 643, A17 [EDP Sciences] [Google Scholar]
- Hernández Garnica, R., Loinard, L., Duran, A., et al. 2024, MNRAS, 535, 2948 [Google Scholar]
- Hirashita, H., & Omukai, K. 2009, MNRAS, 399, 1795 [NASA ADS] [CrossRef] [Google Scholar]
- Hull, C. L. H., Girart, J. M., Kristensen, L. E., et al. 2016, ApJ, 823, L27 [CrossRef] [Google Scholar]
- Hull, C. L. H., Le Gouellec, V. J. M., Girart, J. M., Tobin, J. J., & Bourke, T. L. 2020, ApJ, 892, 152 [NASA ADS] [CrossRef] [Google Scholar]
- Jørgensen, J. K., Schöier, F. L., & van Dishoeck, E. F. 2002, A&A, 389, 908 [CrossRef] [EDP Sciences] [Google Scholar]
- Kóspál, A., Cruz-Sáenz de Miera, F., White, J. A., et al. 2021, ApJS, 256, 30 [CrossRef] [Google Scholar]
- Köhler, M., Ysard, N., & Jones, A. P. 2015, A&A, 579, A15 [NASA ADS] [CrossRef] [EDP Sciences] [Google Scholar]
- Kwon, W., Looney, L. W., Mundy, L. G., Chiang, H.-F., & Kemball, A. J. 2009, ApJ, 696, 841 [NASA ADS] [CrossRef] [Google Scholar]
- Laibe, G., Gonzalez, J. F., & Maddison, S. T. 2012, A&A, 537, A61 [NASA ADS] [CrossRef] [EDP Sciences] [Google Scholar]
- Lebreuilly, U., Mac Low, M., Commerçon, B., & Ebel, D. 2023, A&A, 675, A38 [NASA ADS] [CrossRef] [EDP Sciences] [Google Scholar]
- Lee, S., Lee, J.-E., & Bergin, E. A. 2015, ApJS, 217, 30 [NASA ADS] [CrossRef] [Google Scholar]
- Liu, H. B., Tsai, A.-L., Chen, W. P., et al. 2021, ApJ, 923, 270 [NASA ADS] [CrossRef] [Google Scholar]
- Macías, E., Guerra-Alvarado, O., Carrasco-González, C., et al. 2021, A&A, 648, A33 [EDP Sciences] [Google Scholar]
- Mathis, J. S., Rumpl, W., & Nordsieck, K. H. 1977, ApJ, 217, 425 [Google Scholar]
- Miotello, A., Testi, L., Lodato, G., et al. 2014, A&A, 567, A32 [NASA ADS] [CrossRef] [EDP Sciences] [Google Scholar]
- Morbidelli, A., Marrocchi, Y., Ali Ahmad, A., et al. 2024, A&A, 691, A147 [NASA ADS] [CrossRef] [EDP Sciences] [Google Scholar]
- Motte, F., & André, P. 2001, A&A, 365, 440 [NASA ADS] [CrossRef] [EDP Sciences] [Google Scholar]
- Osorio, M., D’Alessio, P., Muzerolle, J., Calvet, N., & Hartmann, L. 2003, ApJ, 586, 1148 [NASA ADS] [CrossRef] [Google Scholar]
- Ossenkopf, V., & Henning, T. 1994, A&A, 291, 943 [NASA ADS] [Google Scholar]
- Pérez, L. M., Carpenter, J. M., Chandler, C. J., et al. 2012, ApJ, 760, L17 [CrossRef] [Google Scholar]
- Pérez, L. M., Chandler, C. J., Isella, A., et al. 2015, ApJ, 813, 41 [CrossRef] [Google Scholar]
- Pillich, C., Bogdan, T., Landers, J., Wurm, G., & Wende, H. 2021, A&A, 652, A106 [NASA ADS] [CrossRef] [EDP Sciences] [Google Scholar]
- Planck Collaboration Int. XIV. 2014, A&A, 564, A45 [NASA ADS] [CrossRef] [EDP Sciences] [Google Scholar]
- Podio, L., Tabone, B., Codella, C., et al. 2021, A&A, 648, A45 [NASA ADS] [CrossRef] [EDP Sciences] [Google Scholar]
- Radley, I. C., Busquet, G., Ilee, J. D., et al. 2025, ApJ, 981, 187 [Google Scholar]
- Ribas, Á., Bouy, H., & Merín, B. 2015, A&A, 576, A52 [NASA ADS] [CrossRef] [EDP Sciences] [Google Scholar]
- Ricci, L., Testi, L., Natta, A., et al. 2010, A&A, 512, A15 [CrossRef] [EDP Sciences] [Google Scholar]
- Rodríguez, L. F., D’Alessio, P., Wilner, D. J., et al. 1998, Nature, 395, 355 [CrossRef] [Google Scholar]
- Rodríguez, L. F., Porras, A., Claussen, M. J., et al. 2003, ApJ, 586, L137 [CrossRef] [Google Scholar]
- Sabatini, G., Podio, L., Codella, C., et al. 2024, A&A, 684, L12 [NASA ADS] [CrossRef] [EDP Sciences] [Google Scholar]
- Sanhueza, P., Jackson, J. M., Zhang, Q., et al. 2017, ApJ, 841, 97 [Google Scholar]
- Schwartz, P. R. 1982, ApJ, 252, 589 [Google Scholar]
- Sierra, A., Pérez, L. M., Zhang, K., et al. 2021, ApJS, 257, 14 [NASA ADS] [CrossRef] [Google Scholar]
- Silsbee, K., Akimkin, V., Ivlev, A. V., et al. 2022, ApJ, 940, 188 [NASA ADS] [CrossRef] [Google Scholar]
- Takakuwa, S., Saigo, K., Matsumoto, T., et al. 2020, ApJ, 898, 10 [NASA ADS] [CrossRef] [Google Scholar]
- Tazzari, M., Clarke, C. J., Testi, L., et al. 2021, MNRAS, 506, 2804 [NASA ADS] [CrossRef] [Google Scholar]
- Testi, L., Birnstiel, T., Ricci, L., et al. 2014, Protostars and Planets VI (Tucson: University of Arizona Press) [Google Scholar]
- Testi, L., Natta, A., Manara, C. F., et al. 2022, A&A, 663, A98 [NASA ADS] [CrossRef] [EDP Sciences] [Google Scholar]
- The CASA Team (Bean, B., et al.) 2022, PASP, 134, 114501 [NASA ADS] [CrossRef] [Google Scholar]
- Tsukamoto, Y., Machida, M. N., & Inutsuka, S.-I. 2021, ApJ, 920, L35 [NASA ADS] [CrossRef] [Google Scholar]
- Turrini, D., Marzari, F., Polychroni, D., & Testi, L. 2019, ApJ, 877, 50 [NASA ADS] [CrossRef] [Google Scholar]
- Villenave, M., Podio, L., Duchêne, G., et al. 2023, ApJ, 946, 70 [NASA ADS] [CrossRef] [Google Scholar]
- Visser, R., Kristensen, L. E., Bruderer, S., et al. 2012, A&A, 537, A55 [NASA ADS] [CrossRef] [EDP Sciences] [Google Scholar]
- Weidenschilling, S. J. 1977, Ap&SS, 51, 153 [Google Scholar]
- Weingartner, J. C., & Draine, B. T. 2001, ApJ, 548, 296 [Google Scholar]
- Wu, P.-F., Takakuwa, S., & Lim, J. 2009, ApJ, 698, 184 [NASA ADS] [CrossRef] [Google Scholar]
- Ysard, N., Koehler, M., Jimenez-Serra, I., Jones, A. P., & Verstraete, L. 2019, A&A, 631, A88 [NASA ADS] [CrossRef] [EDP Sciences] [Google Scholar]
Appendix A: Data reduction details
Table A.1 summarises the ALMA6 setup 1 and setup 3 observations of the L1551 IRS5 system conducted as part of the FAUST Large Program (2018.1.01205.L PI: S. Yamamoto; Codella et al. 2021). The FAUST setup 1 (Band 6) data were acquired using 12 spectral windows (SPWs), each with a bandwidth (Δν) of 58.6 MHz and a frequency resolution (δν) of 122 kHz. In setup 3 (Band 3), 6 SPWs were observed with Δν = 58.6 MHz and a δν = 61 kHz. In all spectral setups, an additional SPW with a bandwidth of 1.875 GHz was dedicated to observing the thermal dust continuum emission (δν = 0.49 MHz, namely, a velocity resolution of ∼0.65 km s−1 in Band 6 and ∼1.5 km s−1 in Band 3).
Many of the FAUST targets are characterised by very complex spectra, including L1551 IRS5, so line-free channels had to be identified by hand (including those in the SPW ‘continuum’). These spectra were used to create a continuum image and model, which formed the basis for self-calibration gain solutions that were subsequently derived and applied to all the channels for each ALMA configuration. A similar self-calibration technique was used when combining data from multiple configurations, which had the effect of correcting for any position offsets, and aligning the amplitude calibration. Continuum images were made for the analysis according to the process described in Section 2.
Technical details of the FAUST observations through the L1551 IRS5 system.
Appendix B: Additional results
Figure B.1 shows the continuum opacity derived at 1.3 mm and 3.0 mm, as discussed in Section 3.1. At the center of the field, the opacities obtained in Band 6 are higher than those in Band 3, though both remain below 0.2. This indicates that the recovered emission in both ALMA Bands is optically thin.
Figure B2 displays the absolute error, δ(αmm), associated with the slope of the mm-SED (αmm) derived in Section 3.2. This error map is generated via the standard propagation of the system calibration uncertainties (5% in Band 3 and 10% in Band 6; Cortes et al. 2022) and the uncertainties in the observed ALMA fluxes (i.e., the rms noise in each Band). The absolute δ(αmm) ranges from 0.1 to 0.5, at the edge of the structure, where the signal-to-noise ratio reaches the 3σ threshold.
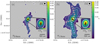 |
Fig. B.1. Continuum optical depth derived towards L1551 IRS5 at the resolution of |

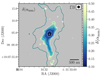 |
Fig. B.2. Map of the absolute error, δ(αmm), associated with αmm and derived based on the continuum emission at 1.3 and 3.0 mm as described in Sect. 3.2. White and blue contours are the same as in Fig. 1a. |
Appendix C: Radial distributions along dusty cavities
Figure C1 summarises the radial profiles of dust temperature, brightness temperature, continuum opacity, dust spectral and emissivity indices along the blue- and redshifted outflow cavity walls of L1551 IRS5. These profiles were derived by averaging values within circular regions, each with an area equivalent to three resolution beams, at the locations indicated by the blue and red crosses in Figure 1d. Lower limits on αmm and βmm were estimated assuming a 3σ upper limit at 3.0 mm where the emission was not detected above this threshold.
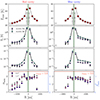 |
Fig. C.1. Radial profiles of observed and derived physical quantities along the outflow cavities associated with L1551 IRS5 - redshifted outflow, left panels (a-d); blueshifted outflow, right panels (e-h). From top to bottom: Dust temperature profiles derived in Sect. 3.1 (panels a, e); Brightness temperature observed with ALMA at 1.3 mm (green dots) and 3.0 mm (blue dots; panels b, f) at the resolution of |


All Tables
All Figures
|
Fig. 1. L1551 IRS5 Class I binary system. (a, b) FAUST maps at 1.3 and 3.0 mm, at the resolution of |
| In the text | |
|
Fig. B.1. Continuum optical depth derived towards L1551 IRS5 at the resolution of |
| In the text | |
|
Fig. B.2. Map of the absolute error, δ(αmm), associated with αmm and derived based on the continuum emission at 1.3 and 3.0 mm as described in Sect. 3.2. White and blue contours are the same as in Fig. 1a. |
| In the text | |
|
Fig. C.1. Radial profiles of observed and derived physical quantities along the outflow cavities associated with L1551 IRS5 - redshifted outflow, left panels (a-d); blueshifted outflow, right panels (e-h). From top to bottom: Dust temperature profiles derived in Sect. 3.1 (panels a, e); Brightness temperature observed with ALMA at 1.3 mm (green dots) and 3.0 mm (blue dots; panels b, f) at the resolution of |
| In the text | |
Current usage metrics show cumulative count of Article Views (full-text article views including HTML views, PDF and ePub downloads, according to the available data) and Abstracts Views on Vision4Press platform.
Data correspond to usage on the plateform after 2015. The current usage metrics is available 48-96 hours after online publication and is updated daily on week days.
Initial download of the metrics may take a while.