Fig. 1.
Download original image
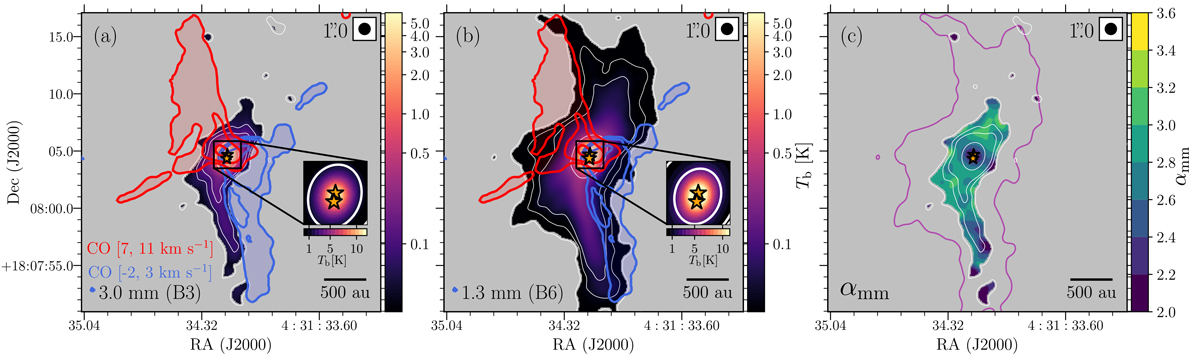
L1551 IRS5 Class I binary system. (a, b) FAUST maps at 1.3 and 3.0 mm, at the resolution of ![]() . White contours show the [3, 6, 10, 100]σ, with σ1.3 mm = 0.13 mJy beam−1 and σ3.0 mm = 0.08 mJy beam−1. The red- and blue-shifted CO(2−1) emission show the [3, 12, 33]σCO emission (σCO = 0.5 mJy beam−1 km s−1). (c) Dust spectral index map. White contours follow those in (a) while the purple one shows the 3σ level in (b). All maps are masked at 3σ and the beams are shown in the upper corners.
. White contours show the [3, 6, 10, 100]σ, with σ1.3 mm = 0.13 mJy beam−1 and σ3.0 mm = 0.08 mJy beam−1. The red- and blue-shifted CO(2−1) emission show the [3, 12, 33]σCO emission (σCO = 0.5 mJy beam−1 km s−1). (c) Dust spectral index map. White contours follow those in (a) while the purple one shows the 3σ level in (b). All maps are masked at 3σ and the beams are shown in the upper corners.
Current usage metrics show cumulative count of Article Views (full-text article views including HTML views, PDF and ePub downloads, according to the available data) and Abstracts Views on Vision4Press platform.
Data correspond to usage on the plateform after 2015. The current usage metrics is available 48-96 hours after online publication and is updated daily on week days.
Initial download of the metrics may take a while.