| Issue |
A&A
Volume 684, April 2024
|
|
|---|---|---|
| Article Number | L12 | |
| Number of page(s) | 12 | |
| Section | Letters to the Editor | |
| DOI | https://doi.org/10.1051/0004-6361/202449616 | |
| Published online | 10 April 2024 | |
Letter to the Editor
FAUST
XIII. Dusty cavity and molecular shock driven by IRS7B in the Corona Australis cluster
1
INAF, Osservatorio Astrofisico di Arcetri, Largo E. Fermi 5, 50125 Firenze, Italy
e-mail: This email address is being protected from spambots. You need JavaScript enabled to view it.
2
Univ. Grenoble Alpes, CNRS, IPAG, 38000 Grenoble, France
3
Materials Science and Engineering, College of Engineering, Shibaura Institute of Technology, 3-7-5 Toyosu, Koto-ku, Tokyo 135-8548, Japan
4
European Southern Observatory, Karl-Schwarzschild Str. 2, 85748 Garching bei München, Germany
5
Excellence Cluster ORIGINS, Boltzmannstraße, 2D-85748 Garching, Germany
6
National Radio Astronomy Observatory, PO Box O Socorro, NM 87801, USA
7
RIKEN Cluster for Pioneering Research, 2-1, Hirosawa, Wako-shi, Saitama 351-0198, Japan
8
Dipartimento di Fisica e Astronomia “Augusto Righi”, Viale Berti Pichat 6/2, Bologna, Italy
9
Department of Astronomy, The University of Tokyo, 7-3-1 Hongo, Bunkyo-ku, Tokyo 113-0033, Japan
10
Department of Chemistry, Biology, and Biotechnology, The University of Perugia, Via Elce di Sotto 8, 06123 Perugia, Italy
11
Leiden Observatory, Leiden University, PO Box 9513 2300 RA Leiden, The Netherlands
12
Center for Astrochemical Studies, Max-Planck-Institut für extraterrestrische Physik (MPE), Gieenbachstr. 1, 85741 Garching, Germany
13
IRAP, Univ. de Toulouse, CNRS, CNES, UPS, Toulouse, France
14
Astrochemistry Laboratory, Code 691, NASA Goddard Space Flight Center, 8800 Greenbelt Road, Greenbelt, MD 20771, USA
15
CY Cergy Paris Université, Sorbonne Université, Observatoire de Paris, PSL University, CNRS, LERMA, 95000 Cergy, France
16
School of Physics and Astronomy, University of Leeds, Leeds LS2 9JT, UK
17
Department of Astronomy, Xiamen University, Xiamen, Fujian 361005, PR China
18
Komaba Institute for Science, The University of Tokyo, 3-8-1 Komaba, Meguro, Tokyo 153-8902, Japan
19
Department of Basic Science, The University of Tokyo, 3-8-1 Komaba, Meguro, Tokyo 153-8902, Japan
20
Center for Frontier Science, Chiba University, 1-33 Yayoi-cho, Inage-ku, Chiba 263-8522, Japan
21
Department of Chemistry, University of Virginia, McCormick Road, PO Box 400319 Charlottesville, VA 22904, USA
22
National Astronomical Observatory of Japan, Osawa 2-21-1, Mitaka-shi, Tokyo 181-8588, Japan
23
Department of Physics and Astronomy, Rice University, 6100 Main Street, MS-108 Houston, TX 77005, USA
24
Centro de Astrobiologíña (CSIC-INTA), Ctra. de Torrejón a Ajalvir, km 4, 28850, Torrejón de Ardoz, Spain
25
NRC Herzberg Astronomy and Astrophysics, 5071 West Saanich Road, Victoria, BC V9E 2E7, Canada
26
Department of Physics and Astronomy, University of Victoria, Victoria, BC V8P 5C2, Canada
27
Université de Bordeaux – CNRS Laboratoire d’Astrophysique de Bordeaux, 33600 Pessac, France
28
Institut de Radioastronomie Millimétrique, 38406 Saint-Martin d’Hères, France
29
Instituto de Radioastronomía y Astrofísica, Universidad Nacional Autónoma de México, A.P. 3-72 (Xangari), 8701 Morelia, Mexico
30
Instituto de Astronomía, Univ. Nacional Autonoma de Mexico, Ciudad Universitaria, A.P. 70-264, Cuidad de Mexico 04510, Mexico
31
Institute of Astronomy and Astrophysics, Academia Sinica, 11F of Astronomy-Mathematics Building, AS/NTU No.1, Sec. 4, Roosevelt Rd., Taipei 10617, Taiwan, R.O.C.
32
Division of Science, National Astronomical Observatory of Japan, 2-21-1 Osawa, Mitaka, Tokyo 181-8588, Japan
33
Institute of Low Temperature Science, Hokkaido University, N19W8, Kita-ku, Sapporo, Hokkaido 060-0819, Japan
34
Department of Physics, The University of Tokyo, 7-3-1, Hongo, Bunkyo-ku, Tokyo 113-0033, Japan
35
Yukawa Institute for Theoretical Physics, Kyoto Univ. Oiwake-cho, Kitashirakawa, Sakyo-ku, Kyoto-shi, Kyoto-fu 606-8502, Japan
36
Departament de Quíñmica, Universitat Autònoma de Barcelona, 08193 Bellaterra, Spain
37
Graduate School of Informatics and Engineering, The University of Electro-Communications, Chofu, Tokyo 182-8585, Japan
38
Department of Astronomy, The University of Texas at Austin, 2515 Speedway, Austin, TX 78712, USA
39
Steward Observatory, 933 N Cherry Ave., Tucson, AZ 85721, USA
40
Star and Planet Formation Laboratory, RIKEN Cluster for Pioneering Research, Wako, Saitama 351-0198, Japan
41
SOKENDAI (The Graduate University for Advanced Studies), Shonan Village, Hayama, Kanagawa 240-0193, Japan
Received:
14
February
2024
Accepted:
23
March
2024
Abstract
Context. The origin of the chemical diversity observed around low-mass protostars probably resides in the earliest history of these systems.
Aims. We aim to investigate the impact of protostellar feedback on the chemistry and grain growth in the circumstellar medium of multiple stellar systems.
Methods. In the context of the ALMA Large Program FAUST, we present high-resolution (50 au) observations of CH3OH, H2CO, and SiO and continuum emission at 1.3 mm and 3 mm towards the Corona Australis star cluster.
Results. Methanol emission reveals an arc-like structure at ∼1800 au from the protostellar system IRS7B along the direction perpendicular to the major axis of the disc. The arc is located at the edge of two elongated continuum structures that define a cone emerging from IRS7B. The region inside the cone is probed by H2CO, while the eastern wall of the arc shows bright emission in SiO, a typical shock tracer. Taking into account the association with a previously detected radio jet imaged with JVLA at 6 cm, the molecular arc reveals for the first time a bow shock driven by IRS7B and a two-sided dust cavity opened by the mass-loss process. For each cavity wall, we derive an average H2 column density of ∼7 × 1021 cm−2, a mass of ∼9 × 10⁻³ M⊙, and a lower limit on the dust spectral index of 1.4.
Conclusions. These observations provide the first evidence of a shock and a conical dust cavity opened by the jet driven by IRS7B, with important implications for the chemical enrichment and grain growth in the envelope of Solar System analogues.
Key words: astrochemistry / stars: formation / ISM: abundances / evolution / ISM: molecules
© The Authors 2024
 Open Access article, published by EDP Sciences, under the terms of the Creative Commons Attribution License (https://creativecommons.org/licenses/by/4.0), which permits unrestricted use, distribution, and reproduction in any medium, provided the original work is properly cited.
This article is published in open access under the Subscribe to Open model. This email address is being protected from spambots. You need JavaScript enabled to view it. to support open access publication.
1. Introduction
Protostellar feedback, resulting from the complex interplay between newly forming Sun-like stars and their environment, plays a crucial role in shaping the chemical composition of the interstellar medium (ISM). The injection of energy and momentum leads to a cascade of physical and chemical processes that influence the molecular composition of the ISM (e.g. Herbst & van Dishoeck 2009; Frank et al. 2014; Ceccarelli et al. 2023, as reviews). Feedback mechanisms, including stellar winds, jets, cavities, and outflows, create a dynamic environment (e.g. shocks) that favours the enrichment of chemical species (e.g. Bachiller et al. 2001) and pave the way for the formation of interstellar complex organic molecules (iCOMs1; i.e. organic molecules with at least six atoms; Ceccarelli et al. 2017). Modern interferometers, such as the Atacama Large Millimeter/submillimeter Array (ALMA), enable astronomers to investigate these processes more thoroughly. However, so far, no clear symmetric dusty cavities opened by protostellar jets have been imaged.
In this context, the ALMA Large Program (LP) Fifty AU STudy of the chemistry in the disk/envelope system of Solar-like protostars (FAUST)2 is designed to characterise the chemical diversity of young solar-like protostars down to a spatial resolution of ∼50 au. FAUST has shown that the chemical structure of molecular envelopes on scales of > 1000 au is influenced by protostellar outflow activity (e.g. Okoda et al. 2021). New case studies are needed to further investigate the role of protostellar feedback on the different scales of envelope–disc systems.
One of the FAUST targets is the nearby Corona Australis (CrA) complex. This region has been the subject of numerous observational campaigns (e.g. Knacke et al. 1973; Harju et al. 1993; Neuhäuser & Forbrich 2008). Several Class 0/I protostars have been identified and characterised in terms of both their chemical (e.g. Groppi et al. 2007; Watanabe et al. 2012; Lindberg et al. 2014) and physical properties (e.g. Nutter et al. 2005; Cazzoletti et al. 2019; Sandell et al. 2021). IRS7B is the protostar at the centre of the CrA cluster, and is classified as a transitional Class 0/Class I object (Groppi et al. 2007; Watanabe et al. 2012). Recently, IRS7B was resolved into a binary system formed by IRS7B-a and IRS7B-b (Ohashi et al. 2023), both associated with discs aligned with a position angle (PA) of 115° and an inclination of ∼65° (Takakuwa et al. 2024). The cluster also contains CXO 34 and IRS7A, two embedded Class I protostars, and SMM 1C (Class 0; Peterson et al. 2011; Lindberg et al. 2015). These studies also revealed prominent continuum emission from SMM 1A, observed with SCUBA-2 at 450 μm (Fig. 1; left) and located ∼2000 au southwest of IRS7B; its nature is still unclear. SMM 1A has been interpreted as either a quiescent prestellar object (e.g. Nutter et al. 2005) or a filamentary structure affected by external irradiation by the Herbig Ae/Be star R-CrA (e.g. Lindberg & Jørgensen 2012; Perotti et al. 2023). The present Letter casts a new light on SMM 1A; we present an investigation of the protostellar feedback of IRS7B on the chemical properties of the ISM in the formation of multiple star–disc systems in CrA.
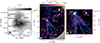 |
Fig. 1. Corona Australis cluster: left: SCUBA-2 map at 450 μm (JCMT archive). Contours are at [12, 18, 30]σ where 1σ = 0.3 mJy beam−1; central: ALMA map of continuum emission at 1.3 mm. The first contour and steps are 6σ (0.48 mJy beam−1) and 70σ, respectively. Right: Zoom onto IRS7B, where only the contours at [3, 6]σ are shown. The detected protostellar objects are labelled. SMM 1A is not detected at 1.3 mm. The cyan line shows the PA of the IRS7B system (i.e. 115°; see text), while the arrow indicates the perpendicular direction. Dashed lines follow the elongated structures detected at 3σ. The synthesised beam is shown in the bottom-left corner of each panel. |
2. Observations and data reduction
The CrA complex was observed as part of the FAUST ALMA LP between October 2018 and September 2019 (2018.1.01205.L; PI: S. Yamamoto; Codella et al. 2021) at a resolution of  (∼52 au at the CrA distance of 130 pc; Lindberg et al. 2014). We observed three spectral setups, one in Band 3 (85–101 GHz) and two in Band 6 (214–234 GHz and 242–262 GHz). Appendix A summarises the telescope setups for both the 12 m array and the Atacama Compact Array (ACA; Band 6 only). The average maximum recoverable scale is ∼21″ (∼2700 au). All observations were made with a precipitable water vapour of < 2.0 mm.
The observations were centred on ( ). The absolute flux calibration uncertainty is 10%. Data were calibrated employing the CASA pipeline 6.2.1–7 (The CASA Team 2022), including additional routines to correct for system temperature and spectral normalisation issues3, and self-calibrated using line-free channels. The final continuum-subtracted line-cubes were cleaned (Hogbom deconvolver) with BRIGGS weighting scheme with ROBUST = 0.5 (Appendix A). The typical rms noise is ∼0.08 mJy beam−1 for continuum and 0.8–3 mJy beam−1 per channel for lines. Self-calibration improved the dynamic range of the continuum maps by factors of between 3 and 10 depending on the data set. The primary beam correction was applied to all the images.
3. Results
3.1. Continuum emission
Figure 1 (central) shows the spatial distribution of dust continuum emission at 1.3 mm in the CrA field, where four compact sources are detected: IRS7B, CXO 34, IRS7A, and SMM1-C. For these sources, the position of the 1.3 mm continuum peaks derived with a 2D Gaussian fit (Appendix B) matches the coordinates reported by Lindberg et al. (2014). In addition, a fifth source (labelled FAUST-5) is detected for the first time SE of IRS7B. No compact counterpart has been identified in the molecular lines in FAUST, suggesting a potential extragalactic origin.
More intriguingly, the continuum emission reveals the existence of two elongated structures SW of the field. These structures are detected (> 3σ) up to ∼1000 au (SW) and ∼1700 au (S), respectively, from IRS7B. A zoom onto the central region (Fig. 1; right) shows that the two structures are symmetric with respect to the normal direction of the disc and extend along the expected direction of the outflow driven by IRS7B, with an opening angle of ∼50° (dashed lines). Following Sabatini et al. (2023), we estimate the H2 column density and mass of the cavity walls, assuming optically thin dust emission, a dust temperature of 30 K (Perotti et al. 2023), a standard gas-to-dust ratio of 100, and a dust opacity of κ1.3 mm= 0.9 cm2 g−1 (Ossenkopf & Henning 1994), which are typical values for icy mantle dust grains and well reproduce multi-wavelength observations of low-mass star-forming regions (e.g. Evans et al. 2001; Shirley et al. 2005). The average N(H2) and mass of each cavity wall are ∼7 × 1021 cm−2 and ∼9 × 10⁻³ M⊙, respectively. This mass corresponds to ∼0.1% of the IRS7B envelope mass estimated by van Kempen et al. (2009). Taking into account an uncertainty of 10% in the absolute flux calibration of the ALMA data, < 15% in the assumed dust temperature (e.g. Sabatini et al. 2022) and ∼30% for the dust opacity (e.g. Sanhueza et al. 2019), the overall uncertainty for N(H2) and the mass of each cavity wall is ≲35%.
3.2. Line emission
We mapped the molecular emission of five CH3OH lines, associated with a range of upper level energy, Eup, from 21 K to 84 K, para-H2CO (30, 3–20, 2), and SiO (5–4) (see Table 1). Figure 2 shows the integrated intensity maps (moment 0 maps) of the brightest lines over the velocity range [0, +12] km s−1.
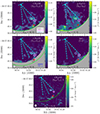 |
Fig. 2. Moment 0 of (a) CH3OH-E (42, 3–31, 2), (b) CH3OH-A (51, 4–41, 3), (c) CH3OH-A (80, 8–71, 7), (d) p-H2CO (30, 3–20, 2), and (e) SiO (5–4) lines around the molecular arc (integrated from 0 to +12 km s−1). Cyan lines and arrows follow Fig. 1. The white contours mark the 5σ emission. Small circles indicate the positions of the brightest spots in CH3OH (42, 3–31, 2), SiO (5–4), and p-H2CO (30, 3–20, 2), which we label “A”, “B”, and “C”, respectively. The red cross indicates the position of SMM 1A (Fig. 1). The green semicircle shows the ALMA Band 6 FoV, while the grey background delimits the region inside each ALMA pointing. |
Properties of the lines detected towards the molecular arc in CrA.
Figure 2a shows the spatial distribution of the CH3OH-E (42, 3–31, 2), and reveals a molecular-arc structure that is confined within the two elongated structures detected in continuum. The arc has a length of ∼3000 au and is located at a projected distance from IRS7B of ∼1800 au, close to the coordinates of SMM 1A (Nutter et al. 2005; Chen & Arce 2010). Additional information is provided by the channel maps (Fig. B.1a). The methanol emission extends from +3.5 to +8.0 km s−1 around the systemic velocity of IRS7B ( km s−1; Ohashi et al. 2023), with most of the emission at blueshifted velocities. Similar structures are traced by the other methanol lines in Figs. 2(b and c). The CH3OH-A (80, 8–71, 7), detected in Band 3, shows several bright spots consistent with the CH3OH 42, 3–31, 2 transition, plus fainter spots outside the Band 6 ALMA field of view (FoV; green circle in Fig. 2). This is consistent with the distribution of CH3OH in Band 6 in the ACA-only maps, where the emission is recovered on a larger FoV at the expense of angular resolution (see Appendix A). In the CH3OH-A (51, 4–41, 3) line, part of the arc structure falls outside the FoV, which is smaller at ∼244 GHz compared to that at ∼218 GHz. The other methanol lines with low Eup (i.e. 22 K and 28 K; Table 1) do not allow a clear identification of the arc-like structure. However, these lines are also detected at > 3σ in the spectra integrated on the brightest emission peaks of the arc structure (Appendix B).
The emission from para-H2CO (30, 3–20, 2), hereafter referred to as p-H2CO, is more extended than that from methanol; it probes both the arc structure, similarly to CH3OH, and an extended component confined mostly within the boundaries of the cone probed by the dust at 1.3 mm (Fig. 2d). The channel maps show that, at redshifted velocities and close to  , the p-H2CO emission is extended over a large portion of the FoV, and therefore it is likely contaminated by envelope emission, while it follows the methanol distribution at blueshifted velocities (Fig. B.1b), revealing arc structures.
The SiO (5–4) moment 0 map reveals two emitting regions (Fig. 2e): the first overlaps on the SW side of the molecular arc traced by CH3OH and H2CO; the second is located at the edge of the FoV, beyond the CH3OH molecular arc, at a distance of > 2100 au from IRS7B. The channel maps show that SiO has the predominant emission component in the blueshifted regime similarly to CH3OH and H2CO (Fig. B.2). This suggests that the blueshifted emission of SiO is also associated with the arc-structure revealed by CH3OH and H2CO (see Sect. 5).
3.3. Physical properties of the molecular arc
To determine the physical conditions of the emitting gas in the molecular arc, we extracted the spectra of all the observed lines at three positions along the arc structure, labelled “A”, “B”, and “C”, and centred at the peak positions of CH3OH (42, 3–31, 2), SiO (5–4), and p-H2CO (30, 3–20, 2), respectively (Fig. 2). Each region has an equivalent area of nine ALMA beams. The spectra and the line fitting are discussed in Appendix B.
Assuming local thermodynamic equilibrium (LTE) and optically thin emission, we constructed rotational diagrams (RDs) to quantify the column density, Ntot, and the rotational temperature, Trot, of CH3OH (Fig. 3) observed in the “A”, “B”, and “C” positions. It is assumed that the methanol A/E ratio is equal to unity, which is a good approximation for temperatures of > 20 K (Wirström et al. 2011; Carney et al. 2019). We derived the critical densities of the observed lines (Table 1) assuming a temperature range of 50–100 K and taking into account downward collision rates in a multi-level system (see Draine 2011). The critical densities range from 104 cm−3 to ∼2 × 106 cm−3 – below the average H2 number densities determined for SMM 1A (i.e. 106 cm−3; Lindberg & Jørgensen 2012) – which supports the assumption of LTE conditions. The RD analysis is obtained using the line intensity integrated on the blueshifted arc component. Taking into account the calibration uncertainty and the rms of the lines spectra, the errors on the integrated intensities is ∼20%. The methanol  are between 6 ± 2 × 1015 cm−2 and 16 ± 3 × 1015 cm−2, with Trot of ∼50–60 K. In region “A”, where methanol peaks, we performed a non-LTE large velocity gradient (LVG) analysis using the grelvg code (Ceccarelli et al. 2003). The resulting Trot, LVG ∼ 70 − 90 K and
  cm−2 are in agreement with those derived from the RDs. Indeed the derived line opacities (τ < 0.5) and gas densities (∼2 × 107 cm−3) support the LTE and optically thin RD assumptions. Our results are consistent with the previous estimate by Perotti et al. (2023), who observed SMM 1A, combining Submillimeter Array (SMA) and Atacama Pathfinder Experiment (APEX) observations, and assuming a Trot∼30 K.
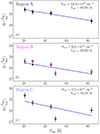 |
Fig. 3. Rotational diagrams of the CH3OH lines (Fig. B.3) for Region: A (in black), B (in magenta), and C (in pale blue). The best-fit values of Trot and total column density are reported. |
Assuming the same range of Trot as that obtained for CH3OH, we derive  cm−2. Our
  values are approximately consistent with the values reported for SMM 1A by Lindberg & Jørgensen (2012), 1013–1014 cm−2, which are based on SMA/APEX observations with a resolution of ∼6″ × 3″, and a Trot ∼ 48 K. Finally, we derived the total column density of SiO, a typical shock-induced sputtering tracer (see Sect. 4), assuming a temperature range of 50–150 K (e.g. Podio et al. 2021), obtaining
  cm−2 towards the SiO emitting peak (B). The estimated Ntot, as well as the [CH3OH]/[SiO] and [CH3OH]/[H2CO] abundance ratios (∼250 − 600, and ∼40–130, respectively), are in agreement with the values derived in shocked regions around low-mass protostars (e.g. Bachiller & Pérez Gutiérrez 1997; Cuadrado et al. 2017; Podio et al. 2021; De Simone et al. 2022).
4. Discussion
The ALMA-FAUST data reveal an extended molecular arc-structure traced by CH3OH, where emission due to H2CO and SiO has also been detected. The arc is located in the SW region of the CrA cluster and matches the coordinates of SMM 1A. The RD analysis of the CH3OH lines supports that the arc is a coherent structure with relatively constant  and
and  . The H2CO distribution shows that the arc is connected to the IRS7B system at the CrA cluster centre.
4.1. Physical origin of the molecular arc in CrA
Methanol is one of the most abundant iCOMs detected in star-forming regions and is considered a key precursor of many prebiotic compounds in space (e.g. Herbst & van Dishoeck 2009; Ceccarelli et al. 2023). The main chemical process for synthesising CH3OH is CO hydrogenation on grains, in which CO is converted to H2CO and then to methanol. This process is extremely efficient in solid phase during the early stages of star formation (e.g. Watanabe & Kouchi 2002; Fuchs et al. 2009; Santos et al. 2022) when the gas temperatures are < 20 K, n(H2) > 104 cm−3, and CO is strongly depleted at the surface of dust grains (e.g. Caselli et al. 1999; Bergin et al. 2002; Sabatini et al. 2019, 2021, 2022). The detection of methanol in the arc-structure in CrA can be associated with either (i) external irradiation (see e.g. Cuadrado et al. 2017) or (ii) shocked regions (e.g. Ceccarelli et al. 2023, and references therein).
The first interpretation was proposed by Lindberg & Jørgensen (2012), who derived a map of H2CO rotational temperature based on SMA/APEX observations with a resolution of 6″ × 3″. The authors found  in the 60–100 K range, and interpreted this high value as a consequence of external illumination by the Herbig Ae/Be star R CrA located at ∼50″ in the NW direction (i.e. ∼6500 au at the cluster distance). The interstellar radiation field in SMM 1A would increase by a factor of 750–3000 when assuming a luminosity of 100–200 L⊙ for R CrA, respectively. This picture is in agreement with the recent estimates of Sissa et al. (2019), who report an R CrA luminosity of ∼130 L⊙, and with the relatively small full width at half maximums (FWHMs) of the CH3OH and H2CO lines (< 1.2 km s−1) fitted in Fig. B.3. Nevertheless, the 50 au angular resolution of the FAUST data enabled us to resolve the arc structure with unprecedented accuracy, that is, a factor of ∼10 greater accuracy than in Lindberg & Jørgensen (2012). The newly discovered arc morphology found in SMM 1A would suggest a source of illumination in the southwest (outside the ALMA FoV) or in the cluster centre. Remarkably, no major illumination source is found in either direction, as only the IRS7B system (Lbol ∼ 4.6 L⊙; Lindberg et al. 2014) and the prestellar source SMM 1As (Lbol ∼ 0.04 L⊙; Sicilia-Aguilar et al. 2013) have been reported in the literature within 50″ of SMM 1A.
On the other hand, the SiO detection at the edge of the CH3OH arc supports the second scenario, in which the arc is the fingerprint of a shocked region. Indeed, SiO is mainly formed by the shock-induced sputtering and/or shattering of the grain mantles and refractory cores (e.g. Caselli et al. 1997; Gusdorf et al. 2008a,b; Jiménez-Serra et al. 2008; Guillet et al. 2011). In this case, the arc-shape suggests the occurrence of a jet driven by IRS7B towards the SW. Moreover, the molecular arc revealed by FAUST is blueshifted, in agreement with the disc flaring reported by Takakuwa et al. (2024), indicating that the near disc-side is to the NE, and therefore the blueshifted jet is towards the SW.
Evidence of outflowing material in CrA was first suggested by Levreault (1988) based on 12CO (2–1) data collected with the Millimeter Wave Observatory (MWO). Although the coarse resolution of the MWO (1 3) prevented the identification of the driving source(s), the blueshifted wing of the outflow is aligned along the direction connecting IRS7B with SMM 1A. Radio continuum observations with ATCA4 at 3, 6, and 20 cm revealed a bipolar structure in the NE-SW direction centred on IRS7B (Harju et al. 2001; Choi et al. 2008; Miettinen et al. 2008). More recently, Liu et al. (2014) also reported an extended (∼70″ in the SMM 1A direction) bipolar radio jet detected at 3.5 cm with the Karl G. Jansky Very Large Array (JVLA; beam ∼4″ × 2″). In Fig. 4 (left panel), we show the JVLA map (green contrours; Liu et al. 2014) superimposed on the SCUBA-2 map at 450 μm (grey scale5). What originally appeared in the SCUBA-2 data as an overdensity of cold gas (e.g. Nutter et al. 2005; Chen et al. 2010) overlaps with both (a) the direction of propagation of the radio-jet discovered by Liu et al. (2014) and (b) the molecular arc traced by methanol (see Fig. 4, right). Moreover, the region in which the radio-jet would collide with the arc also corresponds to the zone in which the
  derived in Lindberg & Jørgensen (2012) reaches its maximum values. In conclusion, based on the arc-shape, the association with the radio jet detected at centimetre wavelengths, and the detection of a typical shock tracer, namely SiO, we conclude that the observed molecular arc is most likely the signature of a bow-shock driven by IRS7B.
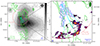 |
Fig. 4. Comparison between JVLA, SCUBA, and ALMA-FAUST observations in CrA: Left: JVLA 3.5 cm map (green contours; Liu et al. 2014) superimposed on the SCUBA-2 map at 450 μm (colour map and grey contours; JCMT archive). The green contours are at [5, 10, 20]σ where 1σ = 8 μJy beam−1, whilst the grey ones are the same as Fig. 1. Right: Zoom onto the arc (Fig. 2a). The blue-shaded area marks the 3σ thermal dust continuum emission taken from Fig. 1. The ALMA, JVLA, and SCUBA beams are shown in these panels in blue, green, and grey, respectively. |
4.2. First imaging of symmetric dusty cavity walls
In light of these findings, the “V”-shaped structure detected in continuum (Fig. 4, right) traces the dust emission from the cavity walls opened by the IRS7B outflow. This is in agreement with the direction of the JVLA radio jet with the orientation of the cavity observed by ALMA (Fig. 4). To our knowledge, this is the first imaging of symmetric cavity walls of dust opened by a jet (on scales of 50 au) in a low-mass star-forming system.
This provides a unique opportunity to study the dust properties at the edge of an outflow cavity. Under the Rayleigh–Jeans approximation, both the size and the properties of interstellar dust grains can be inferred from the spectral index of the dust spectral energy distribution at (sub)millimetre wavelengths (α). We measure α in the cavity walls using Band 6 (1.3 mm) and Band 3 (3 mm) continuum maps. In Band 3, the cavity walls are not detected, and so we derive a lower limit α > 1.4.
The spectral index for typical ISM grains is αISM ∼ 3.7 (Testi et al. 2014), while low values (down to α ∼ 1.5) have been observed in the inner few hundred astronomical units (au) around Class 0/I sources. Low α values can be due to dust growth (e.g. Chiang et al. 2012; Miotello et al. 2014; Galametz et al. 2019), while recent theoretical calculations and observations show that large grains in the envelope may be the result of transport from the site of growth, the inner dense disc, to the envelope via magnetohydrodynamical (MHD) winds (Wong et al. 2016; Giacalone et al. 2019; Tsukamoto et al. 2021; Cacciapuoti et al. 2024). In this context, the estimated α > 1.4 allows the possibility that high-density cavity walls, like those in CrA, are the sites for in situ dust growth in protostellar envelopes.
5. Conclusions
In this Letter, we present high-resolution (50 au) observations of continuum (1.3 mm and 3 mm) and molecular (CH3OH, H2CO and SiO) emission towards the CrA cluster in the context of the ALMA FAUST LP. Our analysis indicates that SMM 1A, previously identified as an extended continuum structure, is associated with a shock driven by IRS7B, and mapped in CH3OH, H2CO, and SiO, and with a conical dusty cavity opened by the mass-loss process. We estimated the H2 column density (∼7 × 1021 cm−2) and mass (∼9 × 10⁻³ M⊙) in the cavity walls, and a lower limit for the dust spectral index (α > 1.4), which could imply the presence of millimetre-sized grains. Based on these results, we conclude that the CrA cluster may be a unique laboratory with which to investigate and test models of dust grain growth in the envelope.
Additional higher-sensitivity and higher-resolution observations of shock tracers, such as SiO and CO, are needed to reveal the IRS7B jet. The discovery of a twin system in IRS7B (Ohashi et al. 2023) opens the possibility that there are two jets. Therefore, the SiO knot could be due to precession. Further mapping of CH3OH emission in the SW region around SMM 1A and beyond the FAUST FoV is also needed to reveal additional interactions between the jet and the CrA envelope on a larger scale; our Band-3 maps already suggest their existence. This would allow us to determine the extent to which the jet influences the chemical composition of the CrA cluster. Ultimately, a more accurate estimate of α will be made possible with more sensitive observations at longer wavelengths, allowing us to constrain the properties and size distribution of the dust grains in the cavity walls and to probe for the formation and/or entrainment of large grains in the envelope.
The lower case “i” emphasises that the term “complex” only applies in the context of the ISM.
Australia Telescope Compact Array (ATCA).
Reduced data can be found at the Canadian Astronomy Data Centre (Project-ID: MJLSG35; https://www.cadc-ccda.hia-iha.nrc-cnrc.gc.ca/en/search/).
Acknowledgments
The authors thank the anonymous Referee for suggestions that improved the manuscript, and A. Garufi for the fruitful discussion and feedback on the properties of interstellar dust. G.S., L.P. and C.C. acknowledge the project PRIN-MUR 2020 MUR BEYOND-2p (“Astrochemistry beyond the second period elements”, Prot. 2020AFB3FX), the PRIN MUR 2022 FOSSILS (Chemical origins: linking the fossil composition of the Solar System with the chemistry of protoplanetary discs, Prot. 2022JC2Y93), the project ASI-Astrobiologia 2023 MIGLIORA (Modeling Chemical Complexity, F83C23000800005), and the INAF-GO 2023 fundings PROTO-SKA (Exploiting ALMA data to study planet forming disks: preparing the advent of SKA, C13C23000770005). G.S. acknowledges the INAF-Minigrant 2023 TRIESTE (“TRacing the chemIcal hEritage of our originS: from proTostars to planEts”; PI: G. Sabatini). L.P. acknowledges the INAF Mini-Grant 2022 “Chemical Origins” (PI: L. Podio). E.B. acknowledges support from the Deutsche Forschungsgemeinschaft (DFG, German Research Foundation) under German’s Excellence Strategy – EXC 2094 – 390783311. M.B. and S.V. acknowledge support from the European Research Council (ERC) Advanced Grant MOPPEX 833460. SBC was supported by the NASA Planetary Science Division Internal Scientist Funding Program through the Fundamental Laboratory Research work package (FLaRe). L.L. acknowledges the support of DGAPA PAPIIT grants IN108324 and IN112820 and CONACyT-CF grant 263356. I.J.-S. acknowledges funding from grants No. PID2019-105552RB-C41 and PID2022-136814NB-I00 from the Spanish Ministry of Science and Innovation/State Agency of Research MCIN/AEI/10.13039/501100011033 and by “ERDF A way of making Europe”. This Letter makes use of the following ALMA data: ADS/JAO.ALMA#2018.1.01205.L (PI: S. Yamamoto). ALMA is a partnership of the ESO (representing its member states), the NSF (USA) and NINS (Japan), together with the NRC (Canada) and the NSC and ASIAA (Taiwan), in cooperation with the Republic of Chile. The Joint ALMA Observatory is operated by the ESO, the AUI/NRAO, and the NAOJ.
References
- Bachiller, R., & Pérez Gutiérrez, M. 1997, ApJ, 487, L93 [Google Scholar]
- Bachiller, R., Pérez Gutiérrez, M., Kumar, M. S. N., & Tafalla, M. 2001, A&A, 372, 899 [NASA ADS] [CrossRef] [EDP Sciences] [Google Scholar]
- Balança, C., Dayou, F., Faure, A., Wiesenfeld, L., & Feautrier, N. 2018, MNRAS, 479, 2692 [Google Scholar]
- Bergin, E. A., Alves, J., Huard, T., & Lada, C. J. 2002, ApJ, 570, L101 [NASA ADS] [CrossRef] [Google Scholar]
- Cacciapuoti, L., Testi, L., Podio, L., et al. 2024, ApJ, 961, 90 [NASA ADS] [CrossRef] [Google Scholar]
- Carney, M. T., Hogerheijde, M. R., Guzmán, V. V., et al. 2019, A&A, 623, A124 [NASA ADS] [CrossRef] [EDP Sciences] [Google Scholar]
- Caselli, P., Hartquist, T. W., & Havnes, O. 1997, A&A, 322, 296 [NASA ADS] [Google Scholar]
- Caselli, P., Walmsley, C. M., Tafalla, M., Dore, L., & Myers, P. C. 1999, ApJ, 523, L165 [Google Scholar]
- Cazzoletti, P., Manara, C. F., Baobab Liu, H., et al. 2019, A&A, 626, A11 [NASA ADS] [CrossRef] [EDP Sciences] [Google Scholar]
- Ceccarelli, C., Maret, S., Tielens, A. G. G. M., Castets, A., & Caux, E. 2003, A&A, 410, 587 [NASA ADS] [CrossRef] [EDP Sciences] [Google Scholar]
- Ceccarelli, C., Caselli, P., Fontani, F., et al. 2017, ApJ, 850, 176 [NASA ADS] [CrossRef] [Google Scholar]
- Ceccarelli, C., Codella, C., Balucani, N., et al. 2023, in Organic Chemistry in the First Phases of Solar-Type Protostars, eds. S. Inutsuka, Y. Aikawa, T. Muto, K. Tomida, & M. Tamura (San Francisco: Astronomical Society of the Pacific), ASP Conf. Ser., 534, 379 [NASA ADS] [Google Scholar]
- Chen, X., & Arce, H. G. 2010, ApJ, 720, L169 [NASA ADS] [CrossRef] [Google Scholar]
- Chen, H.-R., Liu, S.-Y., Su, Y.-N., & Zhang, Q. 2010, ApJ, 713, L50 [NASA ADS] [CrossRef] [Google Scholar]
- Chiang, H.-F., Looney, L. W., & Tobin, J. J. 2012, ApJ, 756, 168 [NASA ADS] [CrossRef] [Google Scholar]
- Choi, M., Hamaguchi, K., Lee, J.-E., & Tatematsu, K. 2008, ApJ, 687, 406 [NASA ADS] [CrossRef] [Google Scholar]
- Codella, C., Ceccarelli, C., Chandler, C., et al. 2021, Front. Astron. Space Sci., 8, 227 [NASA ADS] [CrossRef] [Google Scholar]
- Cuadrado, S., Goicoechea, J. R., Cernicharo, J., et al. 2017, A&A, 603, A124 [NASA ADS] [CrossRef] [EDP Sciences] [Google Scholar]
- De Simone, M., Codella, C., Ceccarelli, C., et al. 2022, MNRAS, 512, 5214 [CrossRef] [Google Scholar]
- Draine, B. T. 2011, Physics of the Interstellar and Intergalactic Medium (Princeton University Press) [Google Scholar]
- Evans, N. J., II, Rawlings, J. M. C., Shirley, Y. L., & Mundy, L. G. 2001, ApJ, 557, 193 [NASA ADS] [CrossRef] [Google Scholar]
- Frank, A., Ray, T. P., Cabrit, S., et al. 2014, in Protostars and Planets VI, eds. H. Beuther, R. S. Klessen, C. P. Dullemond, & T. Henning (Tucson: University of Arizona Press), 451 [Google Scholar]
- Fuchs, G. W., Cuppen, H. M., Ioppolo, S., et al. 2009, A&A, 505, 629 [NASA ADS] [CrossRef] [EDP Sciences] [Google Scholar]
- Galametz, M., Maury, A. J., Valdivia, V., et al. 2019, A&A, 632, A5 [NASA ADS] [CrossRef] [EDP Sciences] [Google Scholar]
- Giacalone, S., Teitler, S., Königl, A., Krijt, S., & Ciesla, F. J. 2019, ApJ, 882, 33 [NASA ADS] [CrossRef] [Google Scholar]
- Ginsburg, A., Sokolov, V., de Val-Borro, M., et al. 2022, AJ, 163, 291 [NASA ADS] [CrossRef] [Google Scholar]
- Groppi, C. E., Hunter, T. R., Blundell, R., & Sandell, G. 2007, ApJ, 670, 489 [CrossRef] [Google Scholar]
- Guillet, V., Pineau Des Forêts, G., & Jones, A. P. 2011, A&A, 527, A123 [NASA ADS] [CrossRef] [EDP Sciences] [Google Scholar]
- Gusdorf, A., Cabrit, S., Flower, D. R., & Pineau Des Forêts, G. 2008a, A&A, 482, 809 [NASA ADS] [CrossRef] [EDP Sciences] [Google Scholar]
- Gusdorf, A., Pineau Des Forêts, G., Cabrit, S., & Flower, D. R. 2008b, A&A, 490, 695 [NASA ADS] [CrossRef] [EDP Sciences] [Google Scholar]
- Harju, J., Haikala, L. K., Mattila, K., et al. 1993, A&A, 278, 569 [NASA ADS] [Google Scholar]
- Harju, J., Higdon, J. L., Lehtinen, K., & Juvela, M. 2001, in Science with the Atacama Large Millimeter Array, ASP Conf. Ser., 235, 125 [Google Scholar]
- Herbst, E., & van Dishoeck, E. F. 2009, ARA&A, 47, 427 [NASA ADS] [CrossRef] [Google Scholar]
- Jiménez-Serra, I., Caselli, P., Martín-Pintado, J., & Hartquist, T. W. 2008, A&A, 482, 549 [NASA ADS] [CrossRef] [EDP Sciences] [Google Scholar]
- Knacke, R. F., Strom, K. M., Strom, S. E., Young, E., & Kunkel, W. 1973, ApJ, 179, 847 [NASA ADS] [CrossRef] [Google Scholar]
- Levreault, R. M. 1988, ApJS, 67, 283 [Google Scholar]
- Lindberg, J. E., & Jørgensen, J. K. 2012, A&A, 548, A24 [NASA ADS] [CrossRef] [EDP Sciences] [Google Scholar]
- Lindberg, J. E., Jørgensen, J. K., Brinch, C., et al. 2014, A&A, 566, A74 [NASA ADS] [CrossRef] [EDP Sciences] [Google Scholar]
- Lindberg, J. E., Jørgensen, J. K., Watanabe, Y., et al. 2015, A&A, 584, A28 [NASA ADS] [CrossRef] [EDP Sciences] [Google Scholar]
- Liu, H. B., Galván-Madrid, R., Forbrich, J., et al. 2014, ApJ, 780, 155 [Google Scholar]
- Miettinen, O., Kontinen, S., Harju, J., & Higdon, J. L. 2008, A&A, 486, 799 [NASA ADS] [CrossRef] [EDP Sciences] [Google Scholar]
- Miotello, A., Testi, L., Lodato, G., et al. 2014, A&A, 567, A32 [NASA ADS] [CrossRef] [EDP Sciences] [Google Scholar]
- Müller, H. S. P., Schlöder, F., Stutzki, J., & Winnewisser, G. 2005, J. Mol. Struct., 742, 215 [Google Scholar]
- Neuhäuser, R., & Forbrich, J. 2008, in Handbook of Star Forming Regions, Volume II, ed. B. Reipurth, 5, 735 [Google Scholar]
- Nutter, D. J., Ward-Thompson, D., & André, P. 2005, MNRAS, 357, 975 [CrossRef] [Google Scholar]
- Ohashi, N., Tobin, J. J., Jørgensen, J. K., et al. 2023, ApJ, 951, 8 [NASA ADS] [CrossRef] [Google Scholar]
- Okoda, Y., Oya, Y., Francis, L., et al. 2021, ApJ, 910, 11 [CrossRef] [Google Scholar]
- Ossenkopf, V., & Henning, T. 1994, A&A, 291, 943 [NASA ADS] [Google Scholar]
- Perotti, G., Jørgensen, J. K., Rocha, W. R. M., et al. 2023, A&A, 678, A78 [NASA ADS] [CrossRef] [EDP Sciences] [Google Scholar]
- Peterson, D. E., o Garatti, A. C., Bourke, T. L., et al. 2011, ApJS, 194, 43 [NASA ADS] [CrossRef] [Google Scholar]
- Podio, L., Tabone, B., Codella, C., et al. 2021, A&A, 648, A45 [NASA ADS] [CrossRef] [EDP Sciences] [Google Scholar]
- Rabli, D., & Flower, D. R. 2010, MNRAS, 406, 95 [Google Scholar]
- Sabatini, G., Giannetti, A., Bovino, S., et al. 2019, MNRAS, 490, 4489 [Google Scholar]
- Sabatini, G., Bovino, S., Giannetti, A., et al. 2021, A&A, 652, A71 [NASA ADS] [CrossRef] [EDP Sciences] [Google Scholar]
- Sabatini, G., Bovino, S., Sanhueza, P., et al. 2022, ApJ, 936, 80 [NASA ADS] [CrossRef] [Google Scholar]
- Sabatini, G., Bovino, S., & Redaelli, E. 2023, ApJ, 947, L18 [NASA ADS] [CrossRef] [Google Scholar]
- Sandell, G., Reipurth, B., Vacca, W. D., & Bajaj, N. S. 2021, ApJ, 920, 7 [Google Scholar]
- Sanhueza, P., Contreras, Y., Wu, B., et al. 2019, ApJ, 886, 102 [Google Scholar]
- Santos, J. C., Chuang, K.-J., Lamberts, T., et al. 2022, ApJ, 931, L33 [NASA ADS] [CrossRef] [Google Scholar]
- Schöier, F. L., van der Tak, F. F. S., van Dishoeck, E. F., & Black, J. H. 2005, A&A, 432, 369 [Google Scholar]
- Shirley, Y. L., Nordhaus, M. K., Grcevich, J. M., et al. 2005, ApJ, 632, 982 [NASA ADS] [CrossRef] [Google Scholar]
- Sicilia-Aguilar, A., Henning, T., Linz, H., et al. 2013, A&A, 551, A34 [NASA ADS] [CrossRef] [EDP Sciences] [Google Scholar]
- Sissa, E., Gratton, R., Alcalà, J. M., et al. 2019, A&A, 630, A132 [NASA ADS] [CrossRef] [EDP Sciences] [Google Scholar]
- Takakuwa, S., Saigo, K., Kido, M., et al. 2024, ApJ, 964, 24 [NASA ADS] [CrossRef] [Google Scholar]
- Testi, L., Birnstiel, T., Ricci, L., et al. 2014, in Protostars and Planets VI, eds. H. Beuther, R. S. Klessen, C. P. Dullemond, & T. Henning (Tucson: University of Arizona Press), 339 [Google Scholar]
- The CASA Team (Bean, B., et al.) 2022, PASP, 134, 114501 [NASA ADS] [CrossRef] [Google Scholar]
- Tsukamoto, Y., Machida, M. N., & Inutsuka, S. 2021, ApJ, 913, 148 [NASA ADS] [CrossRef] [Google Scholar]
- van Kempen, T. A., van Dishoeck, E. F., Hogerheijde, M. R., & Güsten, R. 2009, A&A, 508, 259 [NASA ADS] [CrossRef] [EDP Sciences] [Google Scholar]
- Watanabe, N., & Kouchi, A. 2002, ApJ, 571, L173 [Google Scholar]
- Watanabe, Y., Sakai, N., Lindberg, J. E., et al. 2012, ApJ, 745, 126 [NASA ADS] [CrossRef] [Google Scholar]
- Wiesenfeld, L., & Faure, A. 2013, MNRAS, 432, 2573 [NASA ADS] [CrossRef] [Google Scholar]
- Wirström, E. S., Geppert, W. D., Hjalmarson, Å., et al. 2011, A&A, 533, A24 [NASA ADS] [CrossRef] [EDP Sciences] [Google Scholar]
- Wong, Y. H. V., Hirashita, H., & Li, Z.-Y. 2016, PASJ, 68, 67 [NASA ADS] [CrossRef] [Google Scholar]
Appendix A: Details on data reduction
Table A.1 summarises the details of the dataset acquired with ALMA for the CrA stellar cluster in the context of the FAUST Large Program (see Codella et al. 2021). The B6 data were acquired over 12 spectral windows (SPWs) with a bandwidth (Δν)/frequency resolution (δν) of 59 MHz/122 kHz (∼67-82 km s−1/0.17-0.20 km s−1), whilst 6 SPWs of 59 MHz/61 kHz (∼160-190 km s−1/0.20 km s−1) were observed in B3. In all spectral settings, one additional SPW of 1.9 GHz was dedicated to the thermal dust continuum emission, i.e. 2294 (B6s1), 2404 (B6s2), and 5917 km s−1 (B3). For the latter, δν was 0.5 MHz for B6s1 (0.72 km s−1) and B3 (1.54 km s−1), and 1.1 MHz (1.39 km s−1) for B6s2. Details of the observations and of the calibrators are summarised in Table A.1. The average angular scales covered at these frequencies range from a synthesised beam, θres, of ∼0 4×0
4×0 3 to a maximum recoverable scale, θMRS, of ∼21″; that is, ∼52-2700 au at the source distance of 130 pc (Lindberg et al. 2014). The final datacubes were obtained combining different ALMA configurations, including the 12m array and the ACA. Figure A.1 shows an example of how the distribution of CH3OH (42, 3-31, 2) E, observed in B6-s1, varies with the array used.
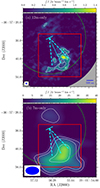 |
Fig. A.1. Moment 0 of CH3OH (42, 3-31, 2) E as observed with (a) the 12m ALMA main array, and (b) with ACA only. The white contours mark the [5, 10, 30]σ emission. The green semicircle shows the ALMA Band 6 FoV of the combined data (see Figure 2). The grey background delimits the region inside each ALMA pointing, while the red square outline the region shown in each panel in Figure 2. The ALMA beam is shown in the lower left corners. |
Technical details of the FAUST observations.
After the data were calibrated (Sect. 2), we followed a two-step deconvolution procedure for imaging: (i) An initial deconvolution was performed with a relatively low threshold (∼4.5 times the dirty noise) and without masking the emission. A reference mask was generated applying the same threshold to the image obtained in this way. (ii) Then, a second deconvolution cycle was performed using the mask generated in step-i as starting point for the AUTO-MULTITHRESH option in TCLEAN. This two-step procedure ensures that all channels, including those with strong spatial filtering, have been properly masked.
Appendix B: Additional notes and results
B.1. Source properties at 1.3 mm
We used the 2D Gaussian fit algorithm provided by CASA (The CASA Team 2022) to analyse the 1.3 mm continuum maps (see Section 3.1) and extract the properties of each source identified in the CrA cluster.
The fitting algorithm provided the positions of the continuum peaks of each source, the intensity of the continuum peaks,  , and the integrated flux density, ∫ℱ1.3mm dΩ, over a circular region encompassing the entire 3σ continuum emission. A summary of these parameters is presented in Table B.1.
Source properties derived at 1.3 mm.
B.2. Channel maps, velocity structures, and spectra
In this subsection we report the channel maps of CH3OH (42, 3-31, 2) and p-H2CO (30, 3-20, 2) and the integrated intensity maps of the blueshifted and redshifted components of SiO (5-4) emission, respectively, in Figures B.1(a,b), and B.2. The velocity structures defined by the three molecular tracers are masked at the 3σ level. The green framed panels in Figure B.1 indicate the systemic velocity of IRS7B, while the blue- and red-framed panels represent the blueshifted and redshifted components of the emission, respectively. The same colour code was used in Figure B.2.
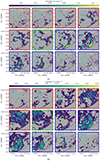 |
Fig. B.1. Velocity channel maps of (a) CH3OH (42, 3-31, 2) E and (b) p-H2CO (30, 3-20, 2). The green framed panel marks the systemic velocity of IRS7B, while the blue- and red- framed panels represent the blueshifted and redshifted components of the emission, respectively. The emission was masked at 3σ, and the colour bar peaks at 75σ, where the average 1σ noise in each channel is (a) 1.2 mJy beam−1 and (b) 2 mJy beam−1. The black arc shows the ALMA Band 6 FoV. Each panel reports the corresponding velocity. (a) Channel map of CH3OH (42, 3-31, 2) E (b)Channel map of p-H2CO (30, 3-20, 2) |
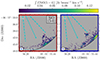 |
Fig. B.2. Integrated intensity maps of the blueshifted and redshifted components of SiO emission (panels a and b, respectively). The blueshifted and redshifted components were derived by integrating the emission at > 3σ in the velocity ranges of ∼[6.7, +12] km s−1 and ∼[0, +6.2] km s−1, respectively. The black arc shows the ALMA Band 6 FoV. |
Figures B.1(a,b) show one velocity channel in steps of three original spectral resolution elements, while in Figure B.2 we show the integrated blueshifted and redshifted components of SiO (5-4) in the velocity ranges of ∼[+6.7, +12] km s−1 and ∼[0, +6.2] km s−1, respectively. Cyan lines and arrows follow Figure 1, and trace the supposed outflow cavity walls detected at 1.3 mm with ALMA (Section 4). Notably, the region shown in Figure B.2 is the only part of the ALMA FoV where extended integrated SiO emission is observed.
Figure B.3 shows the spectra of all the observed lines extracted at three positions along the arc structure, centred at the peak positions of CH3OH (42, 3-31, 2), SiO (5-4) and p-H2CO (30, 3-20, 2), labelled A, B and C, respectively. The targeted lines are detected with a signal-to-noise ratio of > 3σ. The exceptions are the CH3OH-A (31, 3-40, 4) at position B and the SiO (5-4) at position C, where we derived 3σ upper limits (Table 1). All the CH3OH and H2CO lines observed with a spectral resolution of ≤ 0.5 km s−1 show double-peaked profiles, with the redshifted component associated with extended envelope emission, and the blueshifted one due to the arc (see Appendix B). We used the Python Spectroscopic Toolkit (PySpecKit; Ginsburg et al. 2022) to fit the spectra assuming two Gaussian components. In regions B and C, the blueshifted lines have peak velocities of ∼+5 km s−1 and a narrow FWHM of ∼1 km s−1. The red components are centred at +6.6 km s−1, and have FWHMs of between 1 and 1.2 km s−1. The low-frequency methanol lines (Eup = 22 K, and 84 K) observed with a spectral resolution of 1.54 km s−1 show single Gaussian-like profiles. The lines peak between +5.7 and +6.3 km s−1, close to  . The detection of a single Gaussian line in the low-resolution data is due to the coarse spectral resolution. On the other hand, the line width of SiO at position B is ∼3.5 km s−1.
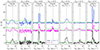 |
Fig. B.3. Spectral overview of the tracers listed in Table 1 extracted at the three positions labeled A, B, and C in Fig. 2a. The extraction regions have an equivalent area of nine beams. Vertical lines report the |

The integrated line intensities of the multiple CH3OH transitions were used to construct rotational diagrams and quantify the column density and rotational temperature of CH3OH along the molecular arc (see Sect. 3.3).
All Tables
All Figures
|
Fig. 1. Corona Australis cluster: left: SCUBA-2 map at 450 μm (JCMT archive). Contours are at [12, 18, 30]σ where 1σ = 0.3 mJy beam−1; central: ALMA map of continuum emission at 1.3 mm. The first contour and steps are 6σ (0.48 mJy beam−1) and 70σ, respectively. Right: Zoom onto IRS7B, where only the contours at [3, 6]σ are shown. The detected protostellar objects are labelled. SMM 1A is not detected at 1.3 mm. The cyan line shows the PA of the IRS7B system (i.e. 115°; see text), while the arrow indicates the perpendicular direction. Dashed lines follow the elongated structures detected at 3σ. The synthesised beam is shown in the bottom-left corner of each panel. |
| In the text | |
|
Fig. 2. Moment 0 of (a) CH3OH-E (42, 3–31, 2), (b) CH3OH-A (51, 4–41, 3), (c) CH3OH-A (80, 8–71, 7), (d) p-H2CO (30, 3–20, 2), and (e) SiO (5–4) lines around the molecular arc (integrated from 0 to +12 km s−1). Cyan lines and arrows follow Fig. 1. The white contours mark the 5σ emission. Small circles indicate the positions of the brightest spots in CH3OH (42, 3–31, 2), SiO (5–4), and p-H2CO (30, 3–20, 2), which we label “A”, “B”, and “C”, respectively. The red cross indicates the position of SMM 1A (Fig. 1). The green semicircle shows the ALMA Band 6 FoV, while the grey background delimits the region inside each ALMA pointing. |
| In the text | |
|
Fig. 3. Rotational diagrams of the CH3OH lines (Fig. B.3) for Region: A (in black), B (in magenta), and C (in pale blue). The best-fit values of Trot and total column density are reported. |
| In the text | |
|
Fig. 4. Comparison between JVLA, SCUBA, and ALMA-FAUST observations in CrA: Left: JVLA 3.5 cm map (green contours; Liu et al. 2014) superimposed on the SCUBA-2 map at 450 μm (colour map and grey contours; JCMT archive). The green contours are at [5, 10, 20]σ where 1σ = 8 μJy beam−1, whilst the grey ones are the same as Fig. 1. Right: Zoom onto the arc (Fig. 2a). The blue-shaded area marks the 3σ thermal dust continuum emission taken from Fig. 1. The ALMA, JVLA, and SCUBA beams are shown in these panels in blue, green, and grey, respectively. |
| In the text | |
|
Fig. A.1. Moment 0 of CH3OH (42, 3-31, 2) E as observed with (a) the 12m ALMA main array, and (b) with ACA only. The white contours mark the [5, 10, 30]σ emission. The green semicircle shows the ALMA Band 6 FoV of the combined data (see Figure 2). The grey background delimits the region inside each ALMA pointing, while the red square outline the region shown in each panel in Figure 2. The ALMA beam is shown in the lower left corners. |
| In the text | |
|
Fig. B.1. Velocity channel maps of (a) CH3OH (42, 3-31, 2) E and (b) p-H2CO (30, 3-20, 2). The green framed panel marks the systemic velocity of IRS7B, while the blue- and red- framed panels represent the blueshifted and redshifted components of the emission, respectively. The emission was masked at 3σ, and the colour bar peaks at 75σ, where the average 1σ noise in each channel is (a) 1.2 mJy beam−1 and (b) 2 mJy beam−1. The black arc shows the ALMA Band 6 FoV. Each panel reports the corresponding velocity. (a) Channel map of CH3OH (42, 3-31, 2) E (b)Channel map of p-H2CO (30, 3-20, 2) |
| In the text | |
|
Fig. B.2. Integrated intensity maps of the blueshifted and redshifted components of SiO emission (panels a and b, respectively). The blueshifted and redshifted components were derived by integrating the emission at > 3σ in the velocity ranges of ∼[6.7, +12] km s−1 and ∼[0, +6.2] km s−1, respectively. The black arc shows the ALMA Band 6 FoV. |
| In the text | |
|
Fig. B.3. Spectral overview of the tracers listed in Table 1 extracted at the three positions labeled A, B, and C in Fig. 2a. The extraction regions have an equivalent area of nine beams. Vertical lines report the |
| In the text | |
Current usage metrics show cumulative count of Article Views (full-text article views including HTML views, PDF and ePub downloads, according to the available data) and Abstracts Views on Vision4Press platform.
Data correspond to usage on the plateform after 2015. The current usage metrics is available 48-96 hours after online publication and is updated daily on week days.
Initial download of the metrics may take a while.