Fig. 1.
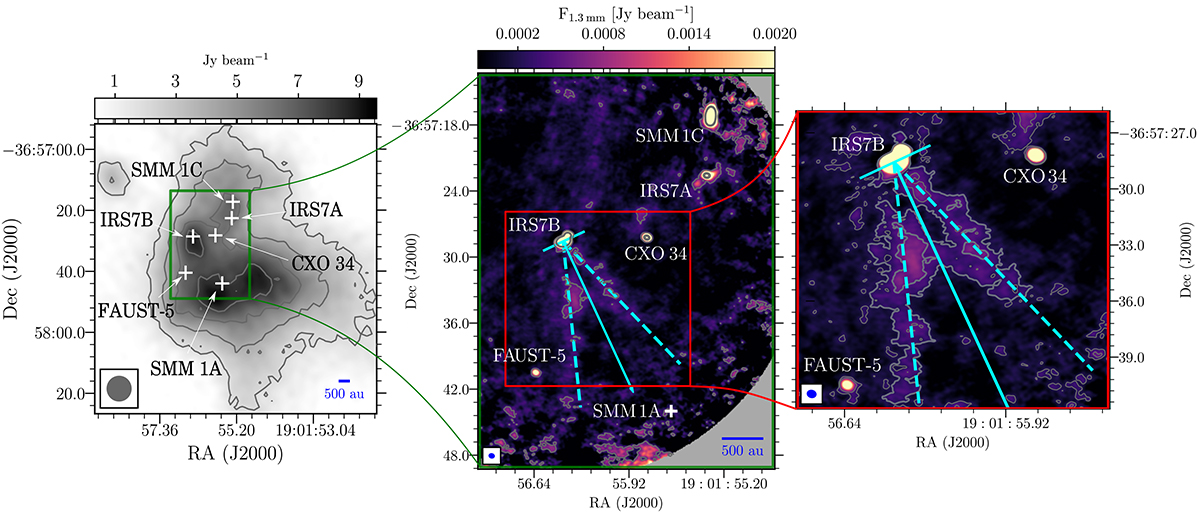
Download original image
Corona Australis cluster: left: SCUBA-2 map at 450 μm (JCMT archive). Contours are at [12, 18, 30]σ where 1σ = 0.3 mJy beam−1; central: ALMA map of continuum emission at 1.3 mm. The first contour and steps are 6σ (0.48 mJy beam−1) and 70σ, respectively. Right: Zoom onto IRS7B, where only the contours at [3, 6]σ are shown. The detected protostellar objects are labelled. SMM 1A is not detected at 1.3 mm. The cyan line shows the PA of the IRS7B system (i.e. 115°; see text), while the arrow indicates the perpendicular direction. Dashed lines follow the elongated structures detected at 3σ. The synthesised beam is shown in the bottom-left corner of each panel.
Current usage metrics show cumulative count of Article Views (full-text article views including HTML views, PDF and ePub downloads, according to the available data) and Abstracts Views on Vision4Press platform.
Data correspond to usage on the plateform after 2015. The current usage metrics is available 48-96 hours after online publication and is updated daily on week days.
Initial download of the metrics may take a while.