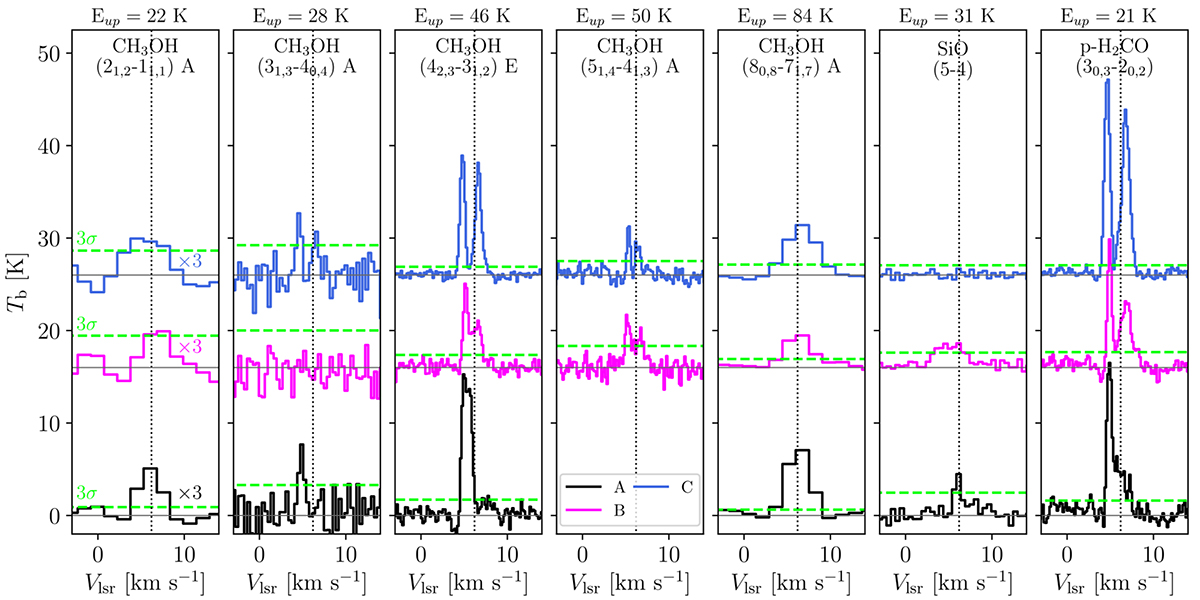
Fig. B.3.
Download original image
Spectral overview of the tracers listed in Table 1 extracted at the three positions labeled A, B, and C in Fig. 2a. The extraction regions have an equivalent area of nine beams. Vertical lines report the ![]() (+6 km s−1; Lindberg et al. 2014, and Ohashi et al. 2023), grey lines mark the zero-level of each spectrum, while green dashed lines show the 3σ level.
(+6 km s−1; Lindberg et al. 2014, and Ohashi et al. 2023), grey lines mark the zero-level of each spectrum, while green dashed lines show the 3σ level.
Current usage metrics show cumulative count of Article Views (full-text article views including HTML views, PDF and ePub downloads, according to the available data) and Abstracts Views on Vision4Press platform.
Data correspond to usage on the plateform after 2015. The current usage metrics is available 48-96 hours after online publication and is updated daily on week days.
Initial download of the metrics may take a while.