Fig. B.2.
Download original image
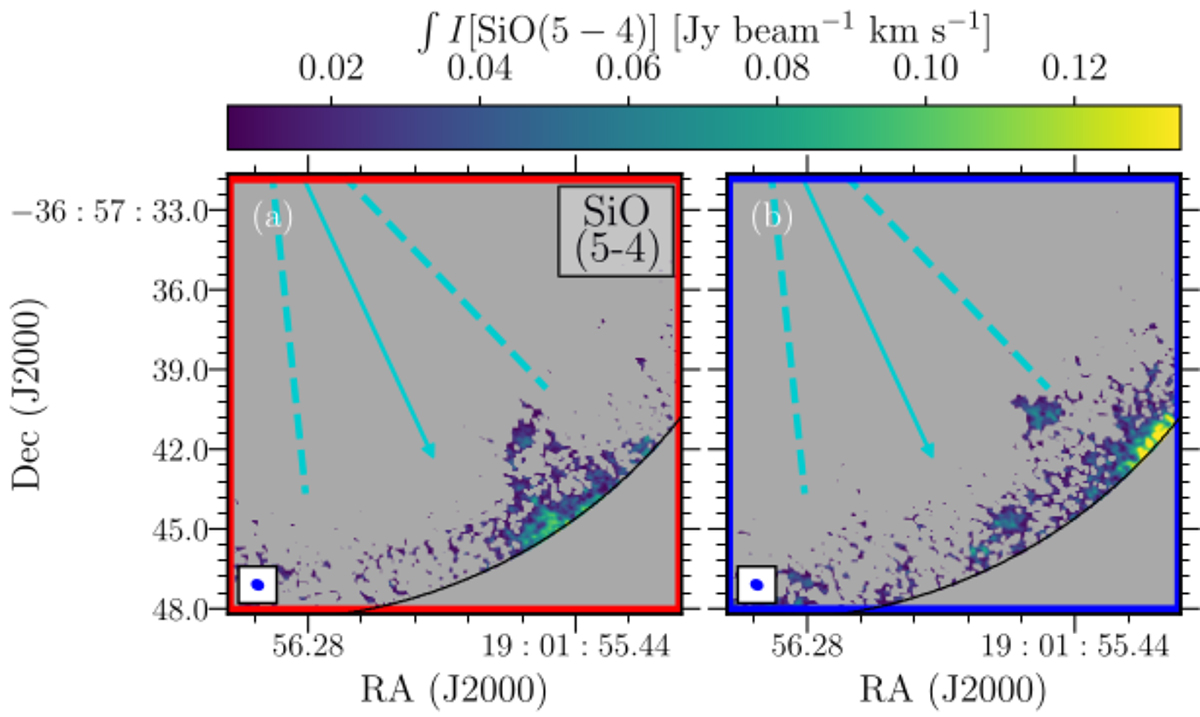
Integrated intensity maps of the blueshifted and redshifted components of SiO emission (panels a and b, respectively). The blueshifted and redshifted components were derived by integrating the emission at > 3σ in the velocity ranges of ∼[6.7, +12] km s−1 and ∼[0, +6.2] km s−1, respectively. The black arc shows the ALMA Band 6 FoV.
Current usage metrics show cumulative count of Article Views (full-text article views including HTML views, PDF and ePub downloads, according to the available data) and Abstracts Views on Vision4Press platform.
Data correspond to usage on the plateform after 2015. The current usage metrics is available 48-96 hours after online publication and is updated daily on week days.
Initial download of the metrics may take a while.