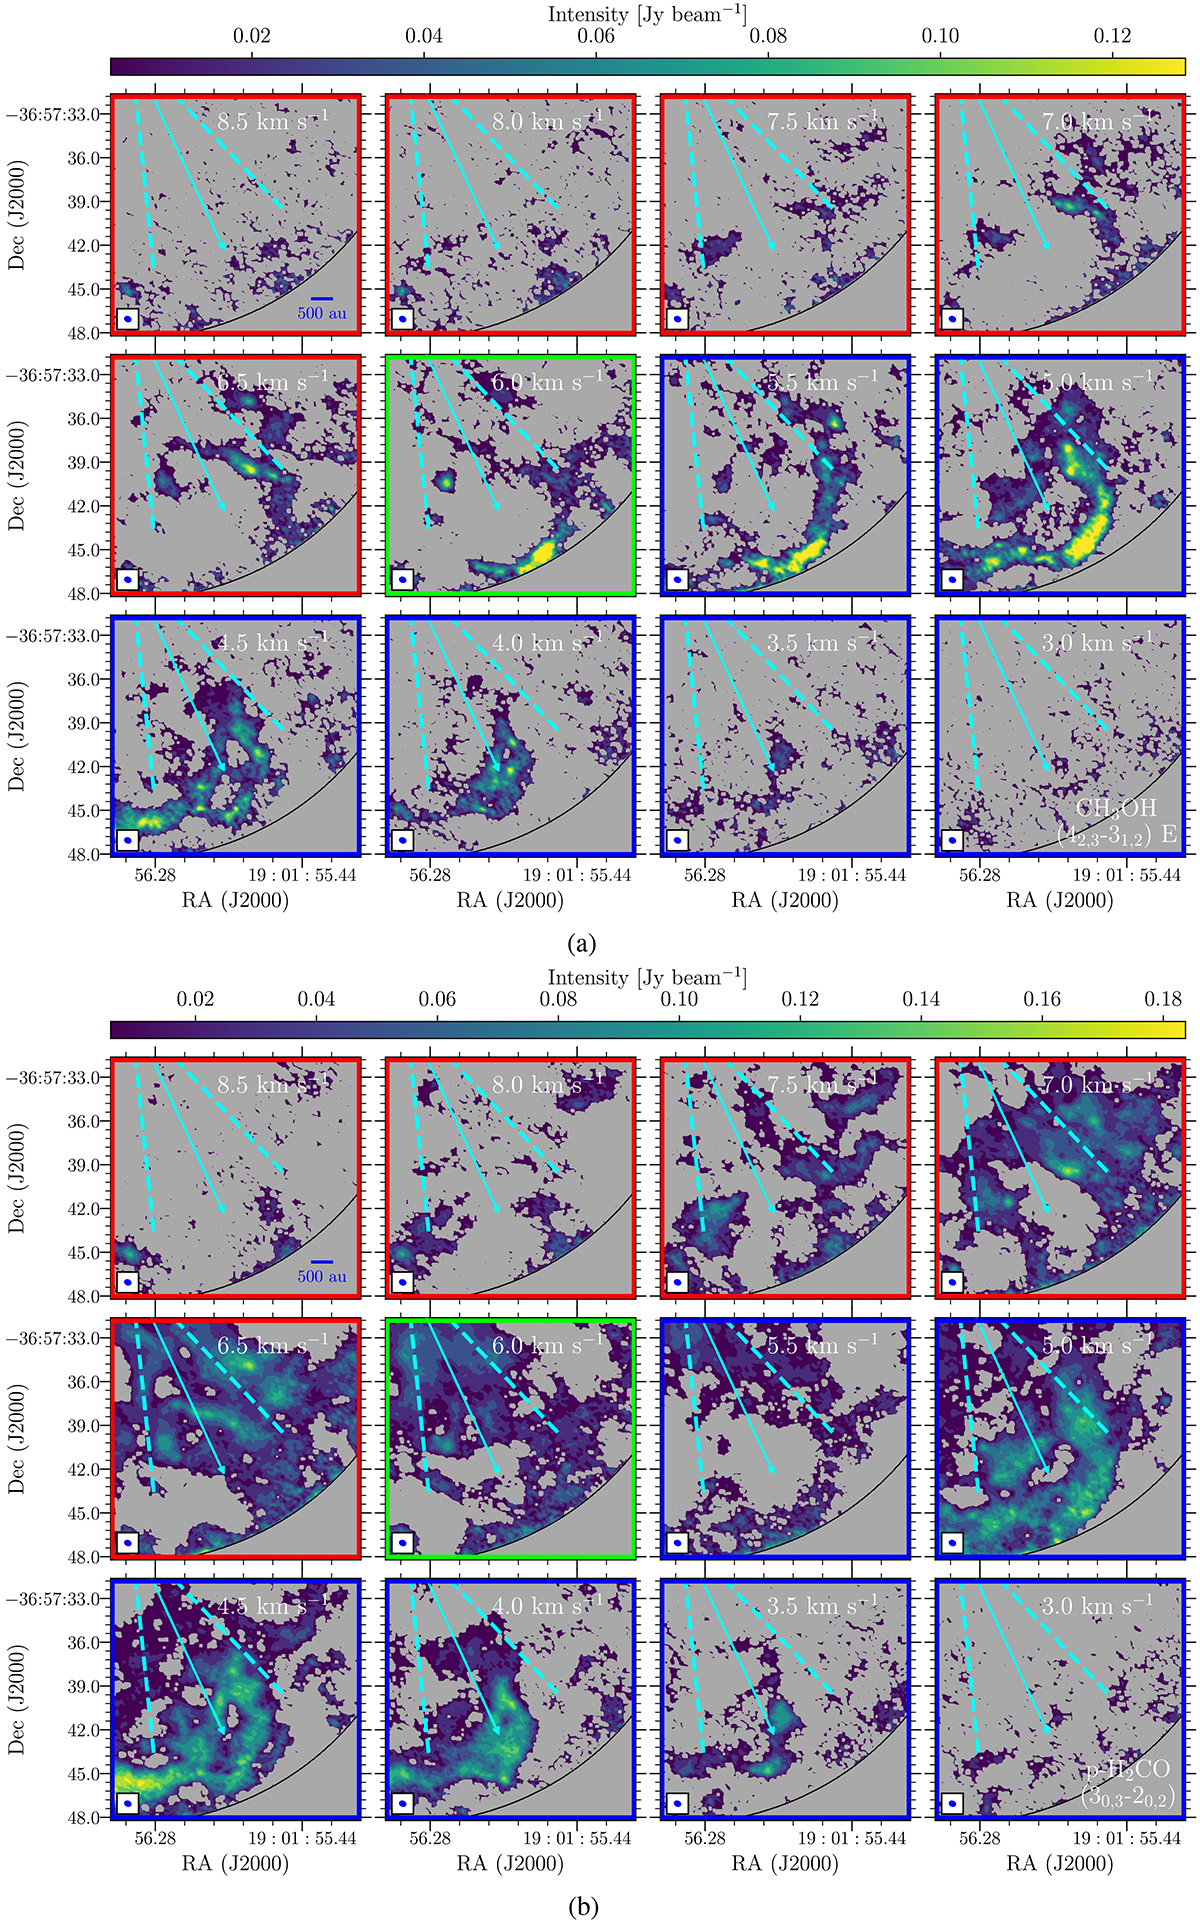
Fig. B.1.
Download original image
Velocity channel maps of (a) CH3OH (42, 3-31, 2) E and (b) p-H2CO (30, 3-20, 2). The green framed panel marks the systemic velocity of IRS7B, while the blue- and red- framed panels represent the blueshifted and redshifted components of the emission, respectively. The emission was masked at 3σ, and the colour bar peaks at 75σ, where the average 1σ noise in each channel is (a) 1.2 mJy beam−1 and (b) 2 mJy beam−1. The black arc shows the ALMA Band 6 FoV. Each panel reports the corresponding velocity. (a) Channel map of CH3OH (42, 3-31, 2) E (b)Channel map of p-H2CO (30, 3-20, 2)
Current usage metrics show cumulative count of Article Views (full-text article views including HTML views, PDF and ePub downloads, according to the available data) and Abstracts Views on Vision4Press platform.
Data correspond to usage on the plateform after 2015. The current usage metrics is available 48-96 hours after online publication and is updated daily on week days.
Initial download of the metrics may take a while.