Fig. 2.
Download original image
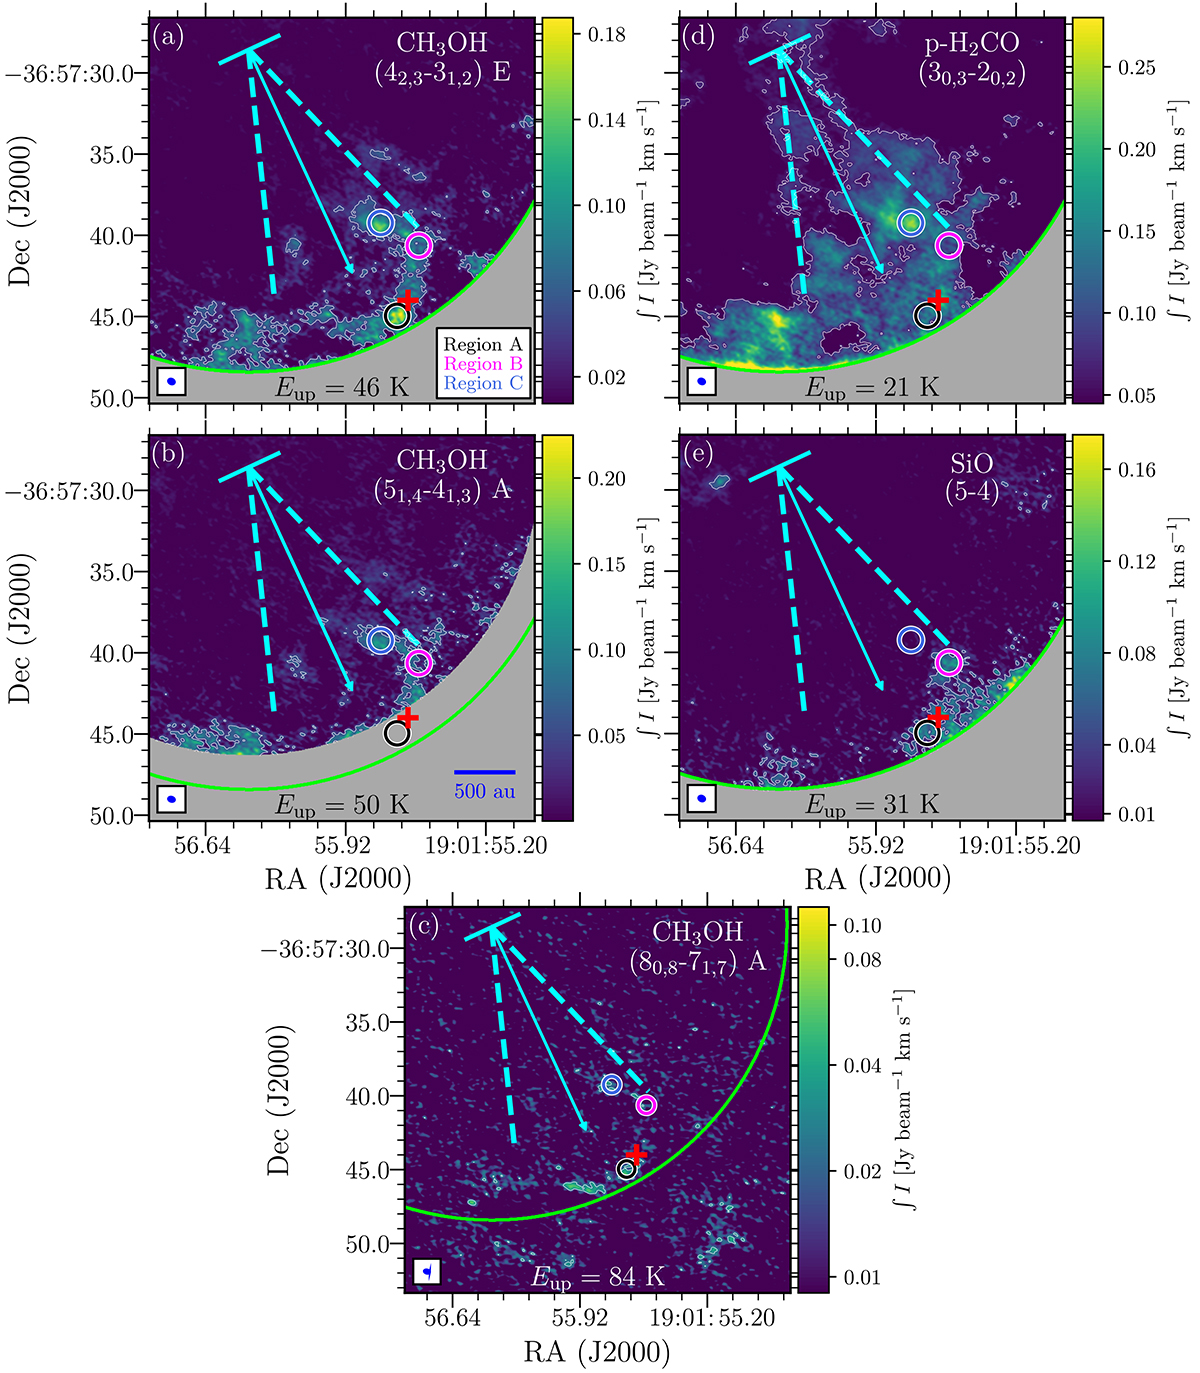
Moment 0 of (a) CH3OH-E (42, 3–31, 2), (b) CH3OH-A (51, 4–41, 3), (c) CH3OH-A (80, 8–71, 7), (d) p-H2CO (30, 3–20, 2), and (e) SiO (5–4) lines around the molecular arc (integrated from 0 to +12 km s−1). Cyan lines and arrows follow Fig. 1. The white contours mark the 5σ emission. Small circles indicate the positions of the brightest spots in CH3OH (42, 3–31, 2), SiO (5–4), and p-H2CO (30, 3–20, 2), which we label “A”, “B”, and “C”, respectively. The red cross indicates the position of SMM 1A (Fig. 1). The green semicircle shows the ALMA Band 6 FoV, while the grey background delimits the region inside each ALMA pointing.
Current usage metrics show cumulative count of Article Views (full-text article views including HTML views, PDF and ePub downloads, according to the available data) and Abstracts Views on Vision4Press platform.
Data correspond to usage on the plateform after 2015. The current usage metrics is available 48-96 hours after online publication and is updated daily on week days.
Initial download of the metrics may take a while.