Fig. 4.
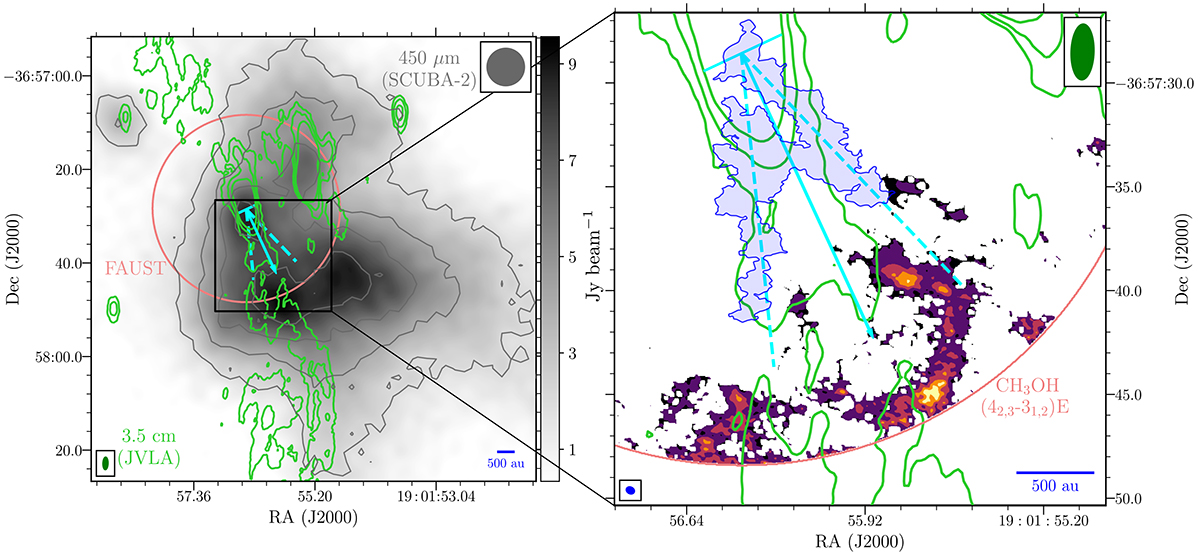
Download original image
Comparison between JVLA, SCUBA, and ALMA-FAUST observations in CrA: Left: JVLA 3.5 cm map (green contours; Liu et al. 2014) superimposed on the SCUBA-2 map at 450 μm (colour map and grey contours; JCMT archive). The green contours are at [5, 10, 20]σ where 1σ = 8 μJy beam−1, whilst the grey ones are the same as Fig. 1. Right: Zoom onto the arc (Fig. 2a). The blue-shaded area marks the 3σ thermal dust continuum emission taken from Fig. 1. The ALMA, JVLA, and SCUBA beams are shown in these panels in blue, green, and grey, respectively.
Current usage metrics show cumulative count of Article Views (full-text article views including HTML views, PDF and ePub downloads, according to the available data) and Abstracts Views on Vision4Press platform.
Data correspond to usage on the plateform after 2015. The current usage metrics is available 48-96 hours after online publication and is updated daily on week days.
Initial download of the metrics may take a while.