Fig. A.1
Download original image
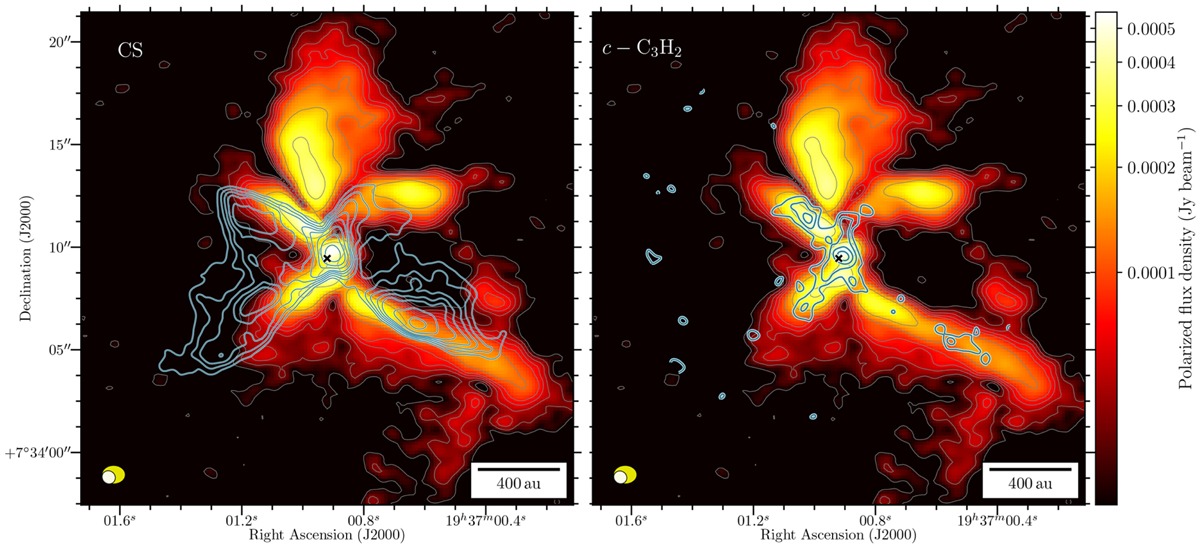
Polarized intensity and molecular line observations around the B335 Class 0 protostellar core (as in Figure 1). The thick light blue contours trace the moment 0 map of the CS (from 6 to 11 km s−1) and c-C3H2 (from 7 to 9.5 km s−1) molecular emission spectral line, at levels of 3, 5, 7, 9, 11, 16, 24, 44 × the rms noise level of each map. In the bottom left corner of each plot the ellipses represent the beam resolution element of a given dataset: yellow for polarized dust emission; white for the CS and c-C3H2 spectral emission lines. ALMA 1.3mm dust polarized emission from Maury et al. (2018) and Maury et al. (in prep.). The CS and c-C3H2 emission lines are from Imai et al. (2016).
Current usage metrics show cumulative count of Article Views (full-text article views including HTML views, PDF and ePub downloads, according to the available data) and Abstracts Views on Vision4Press platform.
Data correspond to usage on the plateform after 2015. The current usage metrics is available 48-96 hours after online publication and is updated daily on week days.
Initial download of the metrics may take a while.