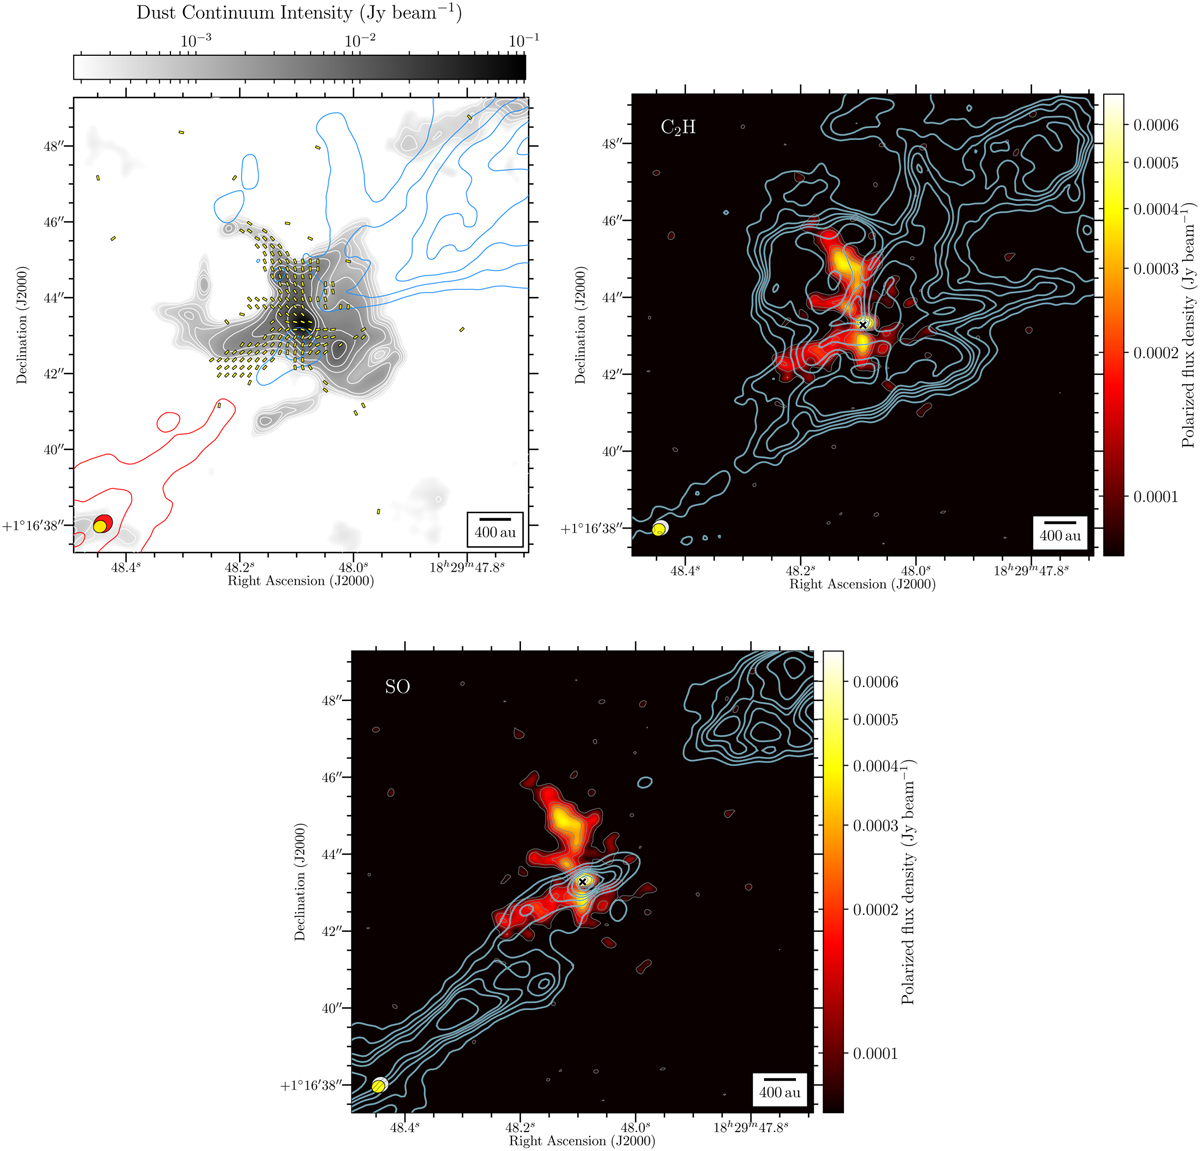
Fig. 4
Download original image
Same as Fig. 1, but for the Serpens Emb 8 Class 0 protostellar core. The blue and red contours trace the moment 0 map of the blueshifted (by integrating emission from −10 to 6.5 km s−1) and redshifted (by integrating emission from 10 to 21 km s−1). The thick light blue contours (top right and bottom panels) trace the moment 0 map of the C2H (by integrating emission from 4.4 to 12.6 km s−1) and SO (by integrating emission from −1.5 to 15.5 km s−1) molecular emission spectral line. ALMA band 0.87mm dust polarized emission is from Hull et al. (2017a). ALMA CO (J = 2 → 1) bipolar outflow emission is from Le Gouellec et al. (2019). C2H and SO emission line is from van Gelder et al. (2020) and Tychoniec et al. (2021).
Current usage metrics show cumulative count of Article Views (full-text article views including HTML views, PDF and ePub downloads, according to the available data) and Abstracts Views on Vision4Press platform.
Data correspond to usage on the plateform after 2015. The current usage metrics is available 48-96 hours after online publication and is updated daily on week days.
Initial download of the metrics may take a while.