Fig. 6
Download original image
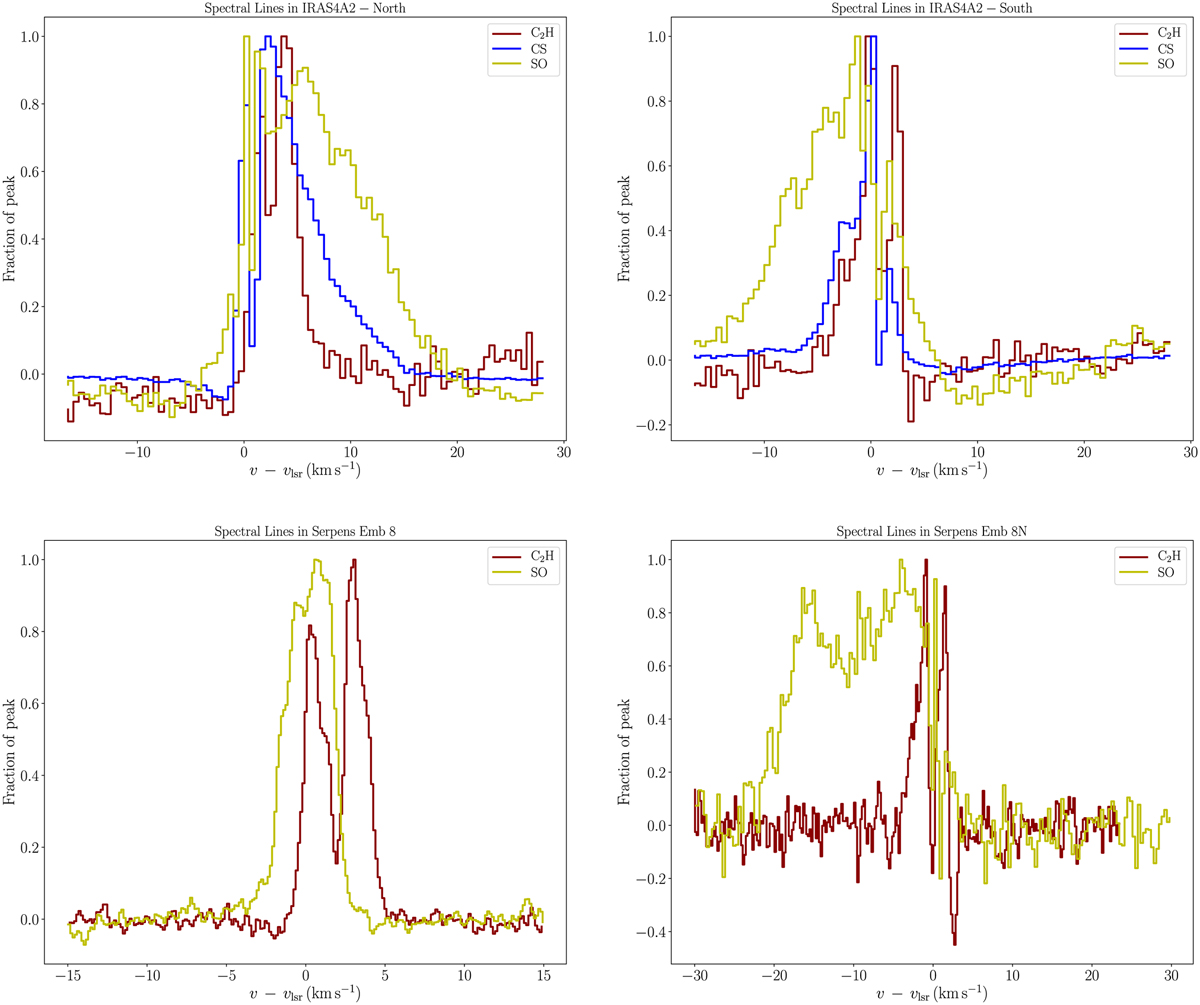
Spectra of molecular emission lines in NGC1333 IRAS4A2, Serpens Emb8, and Serpens Emb 8N. The solid lines show the spectra of the C2H, CS, and SO molecular emission lines, toward the north (top left panel) and the south (top right panel) of IRAS4A2. The spectra of the C2H and SO molecular emission lines toward the redshifted cavity of Serpens Emb 8, and the blueshifted cavity of Serpens Emb 8(N), are shown in the bottom left and bottom right panel, respectively. For IRAS4A, the emission is summed over a circle of 2.5.″ in diameter, centered on the two peaks of C2H visible in the integrated moment 0 map seen in Fig. 3. For Serpens Emb 8 and Serpens Emb 8(N), the spectra are from a circle of 1.″ in diameter located at 800 au from the center, in the redshifted and blueshifted cavity, respectively. In all cases, while the C2H hyperfine structure is detected at the υlsr, the spectra of CS and SO are clearly broader, suggesting material linked to the outflowing gas.
Current usage metrics show cumulative count of Article Views (full-text article views including HTML views, PDF and ePub downloads, according to the available data) and Abstracts Views on Vision4Press platform.
Data correspond to usage on the plateform after 2015. The current usage metrics is available 48-96 hours after online publication and is updated daily on week days.
Initial download of the metrics may take a while.