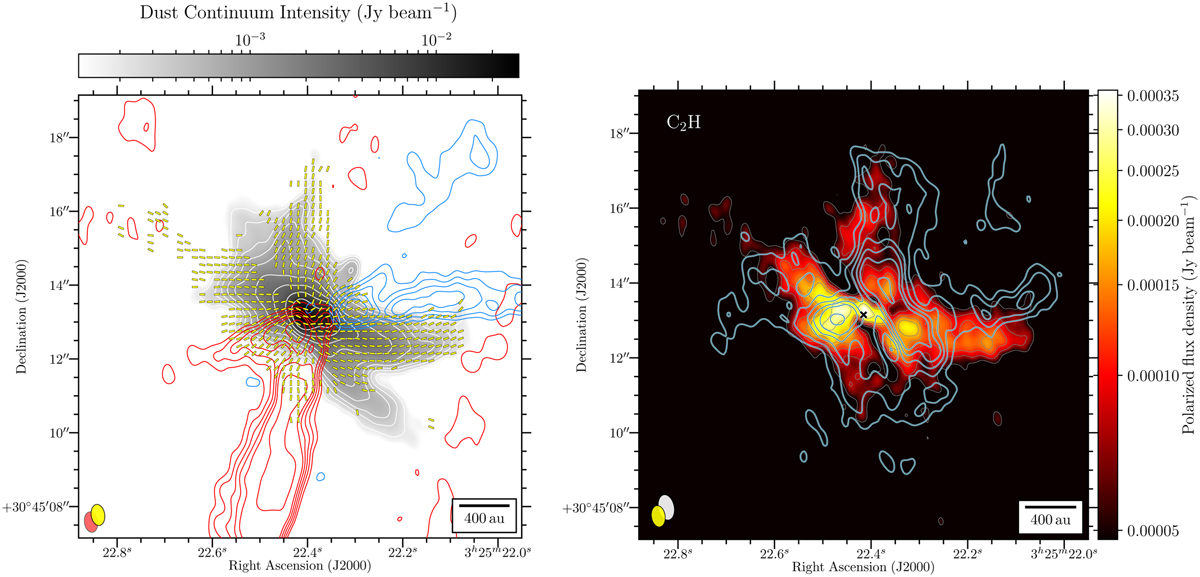
Fig. 2
Download original image
Same as Fig. 1, but for the L1448 IRS2 Class 0 protostellar core. The blue and red contours trace the moment 0 map of the blueshifted (by integrating emission from −16.5 to 3 km s−1) and redshifted (by integrating emission from 6 to 21.5 km s−1). The thick light blue contours (right panel) trace the moment 0 map of the C2H (by integrating emission from 3 to 8 km s−1) molecular emission spectral line. The ALMA 1.3 mm dust polarized emission is from Kwon et al. (2019). The ALMA CO (J = 2 → 1) bipolar outflow emission is from Tobin et al. (2018). The C2H emission line is from ALMA project 2016.1.01501.S, Y. Zhang (in prep.).
Current usage metrics show cumulative count of Article Views (full-text article views including HTML views, PDF and ePub downloads, according to the available data) and Abstracts Views on Vision4Press platform.
Data correspond to usage on the plateform after 2015. The current usage metrics is available 48-96 hours after online publication and is updated daily on week days.
Initial download of the metrics may take a while.