| Issue |
A&A
Volume 665, September 2022
|
|
|---|---|---|
| Article Number | A157 | |
| Number of page(s) | 28 | |
| Section | Planets and planetary systems | |
| DOI | https://doi.org/10.1051/0004-6361/202243763 | |
| Published online | 27 September 2022 | |
Null transit detections of 68 radial-velocity exoplanets observed by TESS
1
Universidad Nacional de Córdoba, Observatorio Astronómico,
Laprida 854,
X5000BGR,
Córdoba, Argentina
e-mail: flavialovos@unc.edu.ar
2
Consejo Nacional de Investigaciones Científicas y Técnicas (CONICET), Godoy Cruz 2290, CABA, CPC 1425FQB, Argentina
3
International Center for Advanced Studies (ICAS) and ICIFI (CONICET), ECyT-UNSAM, Campus Miguelete, 25 de Mayo y Francia, (1650) Buenos Aires, Argentina
4
Gerencia de Tecnología de la información y de las Comunicaciones (GTIC), Subgerencia Vinculación y Desarrollo de Nuevas Tecnologías de la Información, DCAP-CNEA. Centro Atómico Constituyentes, Av. Gral. Paz 1499, ( 1650 ) Buenos Aires, Argentina
Received:
12
April
2022
Accepted:
11
July
2022
In recent years, the number of exoplanets has grown considerably. The most successful techniques in these detections are the radial velocity (RV) and planetary transits techniques, the latter of which has been significantly advanced by the Kepler, K2 and, more recently, the Transiting Exoplanet Survey Satellite (TESS) missions. The detection of exoplanets by means of both transits and RVs is of importance because this allows the characterization of their bulk densities and internal compositions. The TESS survey offers a unique possibility to search for transits of extrasolar planets detected using RVs. In this work, we present the results of our search for transits of RV-detected planets using the photometry of the TESS space mission. We focus on systems with super-Earth- and Neptune-sized planets on orbits with periods of shorter than 30 days. This cut is intended to keep objects with a relatively high transit probability, and is also consistent with the duration of TESS observations on a single sector. Given the summed geometric transit probabilities, the expected number of transiting planets is 3.4 ± 1.8. The sample contains two known transiting planets. We report null results for the remaining 66 out of 68 planets studied, and we exclude in all cases planets larger than 2.4 R⊕ under the assumption of central transits. The remaining two planets orbit HD 136352 and were recently announced.
Key words: planetary systems / techniques: radial velocities / techniques: photometric
© F. V. Lovos et al. 2022
 Open Access article, published by EDP Sciences, under the terms of the Creative Commons Attribution License (https://creativecommons.org/licenses/by/4.0), which permits unrestricted use, distribution, and reproduction in any medium, provided the original work is properly cited.
This article is published in open access under the Subscribe-to-Open model. Subscribe to A&A to support open access publication.
1 Introduction
Our knowledge of exoplanet systems has grown over the past 15 yr thanks to space-based missions (Lissauer et al. 2014; Borucki 2016) that saw the number of confirmed exoplanets increase to more than 50001 (e.g., CoRoT-22 b, Moutou et al. 2011; Kepler-10 b, Batalha et al. 2010; Kepler-11 b, Lissauer et al. 2011). The Transiting Exoplanet Survey Satellite (TESS) is monitoring the nearest and brightest stars, looking for transiting exoplanets of all sizes, but in particular with the ability to detect planets of sizes as small as Earth or Neptune. Unlike Kepler, the TESS mission was designed to survey over 85% of the sky, searching for planets around stars that are typically 30–100 times brighter than those surveyed by Kepler. These stars are therefore more accessible to follow-up observations, and in particular to ground-based spectroscopy (Ricker et al. 2015). The TESS satellite has been operating since 2018 in an Earth-centered orbit with a period of 13.7 days. It observed different sectors in the southern ecliptic hemisphere in the first year and in the northern ecliptic hemisphere for the second year. Each sector comprises two TESS orbits for a duration of 27 days. Its primary mission finished in July 2020, providing around 110 TESS confirmed planets, and more than 5700 TESS candidate planets waiting for confirmation. Since then, an extended mission has been in operation, re-observing the southern hemisphere with a slightly different strategy. TESS provides a unique opportunity to detect and improve our understanding of small, short-period planets.
Of particular interest are those planets that were first detected by radial velocity (RV) surveys. The combination of precise photometric and spectroscopic measurements is particularly important in providing a detailed description of planetary systems. As is commonly known, the planetary radius derived from transit photometry and the mass derived from RV measurements give us planet densities and allow planetary interior structures to be modeled (e.g., Valencia et al. 2006; Fortney et al. 2007b; Seager et al. 2007). In addition, the detection of transiting planets around bright and nearby stars allows atmospheric characterization by transit transmission spectrophotometric measurements (e.g., 55 Cnc e Demory et al. 2011, HD 97658 b Dragomir et al. 2013, HD 189733 b (Brogi et al. 2018), HD 209458 b (Sánchez-López et al. 2019), among many others). During a transit event, the planet and its atmosphere block light from the parent star, producing a partial transmission of the stellar light through the atmosphere of the planet. The transit depth therefore depends on the wavelength, allowing the exploration of atmospheric compositions and environments (Seager & Deming 2010). These observations require planets to orbit very bright stars, with magnitudes of below V = 8. If further planets were detected in transit around similarly bright stars, they would become important assets to understand planetary atmospheres and interiors.
In this context, the main goal of this work is to search for transit signals of known RV planets using TESS data (see Pepper et al. 2020 for the first RV planet revealed to be transiting by TESS data, HD 118203 b), focusing on low-mass planets with sizes smaller than Neptune. Additionally, to achieve high geometric transit probabilities, we restricted the search to planets with periods shorter than 30 days, which is close to the minimum observation time for TESS of 27 days (for one sector). Here, we report 66 null detections and two planets that were detected independently, HD 136352 b and c, and which were reported by Kane et al. (2020).
This article is organized as follows. In Sect. 2 we present our sample of systems. A description of the TESS photometry that we used and the reduction process are given in Sect. 3. In Sect. 4 we present the details of a transit search that was performed by applying the Box Least Square (BLS) algorithm. In Sect. 5 we model the possible transits of each surveyed planetary system based on interior models and physical and orbital parameters from the literature. In Sect. 6 we discuss some interesting cases from the BLS results. In Sect. 7 we present some brief conclusions.
2 Sample selection
We selected a sample of low-mass planets from the catalog of known planets detected by RVs, that is with masses of less than 20 M⊕ (Neptune- or Earth-sized planets). We specifically selected planets with no prior transit detections. We further restricted our sample to planets with periods shorter than 30 days in order to improve the geometric probability of transit occurrence, and to coincide with the minimum observing time of TESS. With these criteria, we selected 94 planets in 58 systems, of which only 43 were included in the TESS observing list of selected targets for short cadence exposure (2 min) and have all the relevant data products. The data considered here include all sectors of TESS photometry observed in the primary mission (Cycle 1 and 2) plus part of Cycle 3. The final sample consists of 68 RV planets around 43 stars. The sum of their geometric transit probabilities is 3.36. The expected number of transiting planets in the sample is therefore 3.4 ± 1.8. The physical parameters of the host stars are listed in Table 1.
The orbital and physical parameters for each planet were compiled from the literature with the aid of the NASA exoplanet archive2. The planets are listed together with their main properties in Table A.1, where we report the orbital periods (Col. 2) and minimum masses (Col. 3). Column 4 presents the reference for each object. Based on the values from the literature and their reported uncertainties, we computed the times of inferior conjunction (TC) assuming the parameters are normally distributed with mean and variance corresponding to the reported values. These times are reported in Col. 5 of Table A.1, and were used for the transit search. The remaining columns list the planetary radii from models and the limiting orbital inclinations inferred from the lack of transits (see Sects. 5 and 6).
In Fig. 1 we plot the planetary masses and orbital periods of the sample planets, together with those of all the known planets in the same region of parameter space. The colors indicate the spectral types of the host stars, and sizes correspond to their relative brightness. We can see stars with spectral types between G and M in a wide range of magnitudes.
In general, planets with longer periods are more massive, probably reflecting observational biases. We see that most of the stars in the sample are M-dwarf stars with low-mass planets on short-period orbits, again probably an effect of the limitations of the RV technique. Thanks to the small sizes of these late stars, the transits are relatively deep compared to larger stars of earlier spectral types, which facilitates the detection of the transits of their companion planets.
 |
Fig. 1 Planet minimum mass vs. orbital period. The color scale corresponds to the spectral types of the host stars, and the sizes are proportional to |
3 TESS photometry and data reduction
We used the high-precision photometry from TESS. In the first and second cycles, TESS data have a minimum cadence of approximately 2 minutes for small areas around selected targets (Stassun et al. 2019) called target pixel files (TPFs); starting from the third observing cycle 20s cadence data were added for selected targets. In particular, in this work we used the calibrated light curves with two-minute cadence acquired from simple aperture photometry (SAP) of TPFs which are processed and corrected for common instrumental systematic errors and background contamination by the Science Processing Operations Center (SPOC) pipeline. These flux time-series data are known as pre-search data conditioning SAP (PDCSAP_FLUX) light curves3 (Jenkins et al. 2016). To obtain these data files, we employed the Python package Lightkurve4, which is also a useful tool for time-series analysis.
The PDCSAP light curves still show fluctuations mostly due to residual instrumental effects and/or from stellar variability. We therefore detrended the light curves using a Savitzky-Golay filter (Savitzky & Golay 1964). This removes low-frequency trends by fitting a low-degree polynomial within a sliding interval, the width of which is selected to avoid affecting the transit curves. For this work, we chose a third-degree polynomial, after evaluating a series of possible degrees. Considering that the timescales of the transits are much shorter than those of the photometric variability, we were able to remove the fluctuations with negligible effect on the subsequent data analysis. We visually inspected the corrected light curves of a number of known transiting planets to verify that the transit shapes were not affected. After that, we normalized the flux time-series data from different sectors5 by their median value and concatenated them. It is important to mention that although the data processing pipeline and the filtering described above help to correct most of the noise and systematic errors, some residual effects still remain in the data, affecting several cadences. Among them, the most important ones are random pointing variations due to momentum dump events from the spacecraft and contamination by diffuse light from the Earth and the Moon (see the TESS Instrument Handbook6). For every target, we studied the TESS data release notes (DRN)7 of all relevant sectors and recorded the cadences affected to take them into account in each analysis.
To account for correlated noise, we used a simple method proposed by Pont et al. (2006). Similar analyses were performed by Cowan et al. (2012), Wong et al. (2016), and Wong et al. (2020). The goal is to check how the scatter behaves as the light curve is binned with the different time bin sizes.
In this work, we compared the root mean square (RMS) of the time-binned light curves, σr, with the RMS we expect for pure additive Gaussian white noise, that is  , where σ1 is the standard deviation of the unbinned data and n is the number of points in each bin. In Fig. 2 we present the observed and expected RMS as a function of time bin-size for three stars in the sample with different magnitudes. The minimum bin size corresponds to the cadence of the telescope (2 min) and the maximum binsize usually depends on the number of data points available for each target. We can see that both RMS values coincide for a bin size of 2 min and that the noise level is lower for brighter objects. On the other hand, the observed noise does not follow the expected relation as the data are binned.
These plots allow estimation of the contribution of red noise for different timescales. The contribution of correlated noise is present in all cases, even for the smallest bins (e.g., in 20 min the red noise contribution is 10–25% of the total noise). In particular, for a timescale of around 2 h (i.e., 120 min), which corresponds to the typical transit duration, red noise constitutes ~50% of the observed scatter. Comparing our results with Fig. 1 in Wong et al. (2020) we find a greater red noise contribution. This is explained by the relatively strong filtering of instrumental systematic noise applied by these latter author compared to that applied here. For example, they discard sharp segments and short-term flux variations, among others, all of which we elected to keep.
Stars with planets in the sample.
 |
Fig. 2 Root mean square for normalized light curves from three host stars of the sample, binned at various intervals (pink curve). The black line indicates the expected standard deviation, assuming pure additive Gaussian white noise, which scales as |
4 Transit search
In this section, we explore the complete photometric data looking for transits of known planets reported in Table A.1 by means of a BLS search (Kovács et al. 2002). We searched for transits in the period range around the known planet periods (local-BLS), but we also performed a global search for transits of putative additional planets (global-BLS).
The frequency grid for the BLS8 was defined by the maximum temporal extent of contiguous observed sectors, but we used resolution elements corresponding to the full span of the observations. For example, GJ 1061 was observed by TESS in sectors 3, 4, 30, and 31. Therefore, we explored periods up to 27 × 2 days, but we use a resolution element dv = 0.01 /Δt, where Δt is the time difference between the first observation in Sector 3 and the last observation in Sector 31, and the factor in the numerator implies an oversampling factor of 100.
For the local-BLS spectrum, we sampled frequencies in a range of ± 10σ from the planet period, where σ is the period uncertainty as reported in the literature. We used a resolution element as needed to sufficiently sample the frequency range around the planetary period.
Finally, as each periodogram has a rising trend of values toward longer periods because of the intrinsic effects of the distribution, we normalized them following Ofir (2014). To remove this tendency and get the correct significance of every peak, we normalized the power spectra by a smoothed version with a moving median filter by choosing a suitable window size.
Six stars of the sample have known transiting planets (GJ 1132, GJ 3473, GJ 357, HD 158259, HD 213885 and HD 219134). In these cases, we obtained the parameters of the known transiting planet(s) using a BLS periodogram. We used these parameters to mask the data to eliminate known transits, and computed a second global-BLS periodogram. In the case of HD 219134, we performed this procedure twice, because it has two previously known transiting planets.
The period of the highest peak in the BLS periodogram and the corresponding signal-to-noise-ratio (S/N) are listed in Table A.2. The first three columns of the table correspond to the global-BLS exploration of each star, and the last three columns correspond to the local-BLS exploration results of each planet.
In Fig. 3 we show the BLSs of target GJ 1132 as an example. The left panel corresponds to BLS of unmasked data, clearly showing the period associated with planet b (Berta-Thompson et al. 2015). The right panel presents the BLS periodogram of masked data. The global-BLS periodogram is represented in black, with a vertical dashed line at the position of the highest peak. The pink shadowed area corresponds to the period range of the local-BLS for the RV-detected planet GJ 1132 c (Bonfils et al. 2018), and a zoomed-in version of this area is shown in the upper-left box inset.
Taking the S/N metric at face value would indicate that many systems have significant signals. However, visual inspection of the BLS periodograms indicates that the actual noise level is much higher and that the real limit for significant signal detection is probably much larger. Following the empirical thresholds for transit detections proposed by Dressing & Charbonneau (2015) and Livingston et al. (2018), in Sect. 6 we discuss the peaks appearing with S/N ≥ 6 in the BLS spectra (see Table A.2). Visual inspection of the light curves shows that in most cases these peaks are associated with fluctuations of flux due to instrumental systematic errors and other effects.
 |
Fig. 3 BLS power periodogram. The global-BLS is in black. The inset on the upper left corner shows the period range of the pink shadowed zone. Dashed vertical lines point out maximum peaks in both ranges of exploration. Left panel: global-BLS analysis for star GJ 1132 without masking the data before the run; the highest peak is detected at the period of the known transiting planet. Right panel: global- and Local-BLS spectra computed using masked data; the latter explores the range of periods corresponding to the RV-detected planet GJ 1132 c. |
5 Transit model
In this section, we describe the models that are used to visualize the potential planetary transits. To model the transits we used the code Batman (Kreidberg 2015). The transit model is parameterized by the planet period (P), the semimajor axis (a/R*), the orbital inclination9, the orbital eccentricity (e), the longitude of pericenter (ω), and radius ratio (RP/R*). Most of the parameters were obtained from the literature as described in Sect. 2. However, the planetary radii were obtained from the internal structure model given by Fortney et al. (2007b,a). This model predicts the radii from masses ranging from 0.01 to 1000 M⊕ for different combinations of ice, rock, and iron. Based on the results of the modeling, the authors provided analytical relationships between masses and radii for (1) planets of pure ice and ice and rock mixtures (“Ocean planets”; Rwat), and (2) planets composed of pure rock, rock and iron mixtures, and pure iron (“Terrestrial planets”; Rter):
with radii in R⊕, and masses in M⊕. The imf and rmf coefficients indicate the composition, and stand for the “ice mass fraction” for ocean planets (1.0 for pure ice and 0.0 for pure rock) and the “rock mass fraction” for terrestrial planets (1.0 for pure rock and 0.0 for pure iron), respectively. In all cases, the ice layer is always above the rock layer, which in turn overlays iron. From the measured minimum masses, and assuming perfectly edge-on orbits (i = 90°), we computed radii for pure ice, pure rock, and pure iron compositions. The resulting radii are reported in Cols. 6–8 of Table A.1.
We modeled the light curves using a quadratic limb darkening (LD) law. The quadratic coefficients a and b for the TESS bandpass were computed from the tables in Claret (2018) by interpolating the values of Teff and log(g) of the host star.
Given the large pixel size of TESS (21”), the contribution to the flux inside the photometric aperture from nearby stars could be significant. However, PDC_SAP light curves are corrected for flux contamination. Also, these are relatively bright stars, and so the contamination that may be present is assumedly low. We therefore decided not to include contamination in our transit model.
Detection limits
We estimated upper limits for transit depths and planetary radii for each planet. Results are presented in Table A.3. To do this, we phase folded the light curves using the mid-transit times and periods from the literature (see Table A.1). Assuming edge-on orbits, we estimated the respective transit windows (i.e., transit duration).
We then computed the standard deviation of the measured relative flux within the transit window. We considered this as a conservative upper detection limit for the depth of transits (Col. 2, upper limit (Rp/R*)2). The corresponding planetary radius Rp is presented in Col. 310. This gives us a limit above which a transiting planet would be detected. In all cases, the computed upper limit is below 2.4 R⊕, and so we excluded transits of planets bigger than 2.4 R⊕ for all systems; the median excluded radius is 1.4 R⊕, and the minimum is 0.48 R⊕.
Finally, we compared the upper planetary radius with the radius obtained from the models (showing in Table A.1). Of the 68 sampled planets, 28 have upper planetary radii smaller than Riron, the radius of a planet made of iron. For these systems, a transit can be fully discarded under the model assumptions. For 51 planets, the upper limit is smaller than Rrock.
 |
Fig. 4 55 Cnc e. Left: BLS periodogram, dashed vertical black line indicates the maximum peak. Middle: transit model plus light curve folded with BLS results. Right: transit model plus light curve folded with literature parameters. Solid lines of different colors correspond to models for different radii (green for Rice, orange for Rrock and blue for Riron), green dashed vertical lines indicate ±σϕ, the orbital phase uncertainty. |
6 Results
To test our methodology, we applied it to 55 Cnc e, a well-studied transiting super-Earth planet orbiting a nearby bright star. This planet was discovered by McArthur et al. (2004) who reported an incorrect orbital period of 2.8 days. Some years later, Dawson & Fabrycky (2010) argued that the correct period of the planet was about 0.74 days, which was later confirmed by transit observations (Winn et al. 2011). Over the years, combining RV measurements and transit observations (Winn et al. 2011; Demory et al. 2011; Bourrier et al. 2018, among others) has considerably improved the determination of the parameters of 55 Cnc e, such as mass (~8 M⊕) and radius (~1.9 R⊕).
Figure 4 (left panel) shows the TESS BLS power spectrum, which exhibits a clear peak with a S/N of 105 at the period corresponding to the known transiting planet and its harmonics. In the middle panel, we plot the phase-folded curve using the period and phase obtained with the BLS, where we have superimposed the synthetic models computed using literature parameters and estimated radii, as described above. Finally, the rightmost panel of the figure presents the light curve phase folded using the period and transit phase from the literature (Table A.1.) with vertical dashed lines that indicate the phase uncertainty (σϕ). These figures show the good accuracy both in BLS results and in the calculation of TC from the literature parameters. In addition, we see that the estimated radii are in agreement with the measured value of 1.9 R⊕ We can also check this in Table A.3, where the upper limit to the radius is smaller than the radius of a planet of pure rock. This shows the reliability of the methodology applied.
6.1 Null transit detections
In this section we discuss the noteworthy cases from the BLS results, defined as those with maximum peak with S/N ≥ 6 (see Table A.2). These discussions are based on visual inspection of the light curves and the TESS DRN11 of the relevant sectors. Six systems of the sample already have at least one known transiting planet. These are GJ 1132, GJ 3473, GJ 357, HD 158259, HD 213885, and HD 2191345. In these cases, we computed the BLS spectrum masking the cadences that correspond to the known transits.
6.1.1 61 Vir
61 Virginis is a system with three RV planets with periods of 4.2, 38.0, and 124.0 days (Vogt et al. 2010). Only the innermost 5.1-M⊕ planet fulfills the criterion (period <30 days) to be included in our sample. This target was observed by TESS in a total baseline of 25.27 days.
The BLS power spectrum is presented in Fig. 5. A peak with S/N ~ 10.5 is seen at a period of 7.5 days. However, this is not due to a transiting planet. We can see in the light curve (bottom panel of Fig. 5) that one of the putative transits falls just at the beginning of the orbit in sector 10. This part of the time series comes immediately before cadences associated with instrumental systematic errors that causes the measured S/N. Additionally, the second transit is aligned with a pointing instability, according to the corresponding data release notes.
To verify that this detection is spurious, we computed the BLS spectrum without including the cadences at the beginning of the orbit (< 1571.05 days). We obtained the highest peak at a period of 1.49 days with S/N ~ 9. We phase folded the light curve to this period and binned the folded data (see Fig. 6). No transit feature is detected in the folded curve, and so we discarded a possible planetary transit there.
On the other hand, in Fig. 7, we show the folded light curve using the literature ephemerides for planet b, together with the models of different planetary radii. A central planetary transit is clearly absent from the light curve for planets with radii above that of a planet of pure iron. This agrees with the computed local-BLS spectrum, which does not show any peak in the region around the period of planet b.
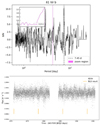 |
Fig. 5 61 Vir. Top: global-BLS periodogram plus inset with a local-BLS spectrum. Dashed vertical black line indicates the maximum peak and period respective, and pink zone points out the region of the local-BLS analysis. Bottom: light curve from TESS photometry. Orange lines show the signals detected by global-BLS. |
 |
Fig. 6 61 Vir. Light curve folded at a period of 1.49 days, detected from the BLS-spectrum obtained discarding cadences at <1571.05 days. Red points are the TESS data and the dashed line corresponds to the binned flux. |
 |
Fig. 7 61 Vir b. Transit model plus light curve folded with literature parameters. Red points are the TESS data binned. Solid lines of different colors correspond to models for different radii (green for Rice, orange for Rrock and blue for Riron), and the dashed green lines indicate ±σø, the orbital phase uncertainty. |
6.1.2 GJ 15 A
GJ 15 A b is a planet with a M sin i of 3.03 M⊕ orbiting a M-dwarf star with a period of 11.44 days (Howard et al. 2014; Pinamonti et al. 2018). This star was observed by TESS in Sector 17. The global- and local-BLS spectra are presented in the top panel of Fig. 8, and the results are listed in Table A.2.
The global-BLS exhibits a peak at 4.34 days with a S /N ~ 9.7. In the bottom panel of Fig. 8 we show the light curve with vertical lines indicating the positions of the transits. Visual inspection of the light curve shows that one putative transit is located at the end of sector 17, in a region with increased instrumental variability that was not adequately corrected. We reran the BLS algorithm discarding those cadences and obtained a new peak close to 1.3 days with a S /N ~ 9. The folded light curve with this new period is presented in Fig. 9. We can see a flux drop of ~0.01% in depth (100 ppm), which, for the stellar radius listed in Table 1, would correspond to a planet with a radius of 0.41 R⊕. However, for a circular orbit, the transit of this planet should last around 63 min, while the measured duration is of about 3 h. This signal is therefore probably not of planetary origin. On the other hand, the duration measured would be consistent with depth and period if we were to consider an eccentric orbit with e > 0.738.
Also, there is no significant peak in the local-BLS spectrum around the period of GJ 15 A b. In Fig. 10 we present the phase-folded TESS light curve using the period from the literature. Model transit curves computed as described in Sect. 5 are superimposed. As in the previous case, we conclude that no transit is detected.
6.1.3 GJ 887
GJ 887 is a multiplanet system with two super-Earth planets discovered by Jeffers et al. (2020) using radial velocity measurements. They have orbital periods of 9.262 days and 21.789 days, for planet b and c, respectively. This target was observed in the years 2018 (sector 2) and 2020 (sector 28) by TESS (see Table 1). Jeffers et al. (2020) also analyzed TESS photometry without finding evidence of transits, but these authors only used data from sector 2.
We found a peak at a period of 15 days and a S /N ~ 39 in the global-BLS spectrum and a signal of S/N ~ 14 around the period of planet b. The local-BLS spectrum for planet c does not present any noteworthy feature. In Fig. 11 we show the global-BLS spectrum and corresponding local-BLS spectrum of planet b. The TESS light curves of both sectors are shown in Fig. 12. The indicated transits correspond to the maximum peak for global-BLS (top panels) and for the local-BLS (bottom panels). There is a flux drop around BTJD = 2458 366, when cadences are affected by scattered Moon and Earth light. Also in its vicinity there is increased jitter noise caused by momentum dump events (See DRN for sector 2). The affected cadences are responsible for the peak found by the global-BLS analysis. The other transit times coincide with TESS downlink gaps.
As we could not obtain full orbital parameters from the literature, we instead folded the curve using the parameters obtained from the local-BLS analysis and compared it with the synthetic models superimposed. This is shown in Fig. 13, where we can see a central drop with some offset from phase zero; this corresponds to cadences closer to 2 458 366 BTJD. We therefore cannot claim a transit detection because the data involved are not reliable, and no other flux drops of that type were observed in the data.
 |
Fig. 9 GJ 15 A. Folded light curve with a period of 1.3 days obtained from the BLS spectrum after discarding final cadences of sector 17. Red points are the TESS data and the dashed line corresponds to the binned flux. |
 |
Fig. 10 Same as Fig. 7 but for GJ 15 A b. |
 |
Fig. 11 GJ 887. Global-BLS periodogram plus a small box with a zoom region showing the local-BLS for planet b. The dashed vertical black line indicates the maximum peak and respective period, and the pink zone points out the zoomed-in region shown in the small box. |
6.1.4 HD 136352
This star hosts three RV planets detected by Udry et al. (2019) using the High Accuracy Radial velocity Planet Searcher (HARPS) spectrograph (Mayor et al. 2003). The two inner planets were discovered to transit using TESS photometry (Kane et al. 2020), and a follow up with the CHaracterising ExOPlanets Satellite (CHEOPS) telescope showed that the third outer planet (Pd = 107 days) also transits its star (Delrez et al. 2021). The analysis presented here was performed independently. The two innermost planets b and c have masses of 4.81 and 10.8 M⊕ and orbital periods of 11 days and 27 days, respectively, and were therefore included in our sample.
A blind search using the global-BLS analysis shows a significant peak close to the period of planet b (S/N ~ 14 at 11.68 days, see also Table A.2). We show in Fig. 14 the respective periodogram and the TESS light curve with the detected transits indicated. We see that the algorithm detected the deepest transit (produced by planet c; around BTJD = 2458 651), which for the peak period means a second transit should have occurred during the data gap between TESS orbits around BTJD = 2 458 639. When we search for these planets blindly, we miss them. One of the reasons is that we have a full baseline of 25 days. Only one transit of planet c is therefore present in the TESS light curve. Another reason is that the PDCSAP light curve exhibits residual systematic errors from the reduction and correction process. To solve this, Kane et al. (2020) produced their own custom light curve from TPFs of this bright star.
On the other hand, restricting the periods to be close to the two inner planets reveals one deep transit for planet c and two transits of planet b (see Fig. 15), and shows that the period detected in the global analysis is incorrect. In Fig. 15 we show global-BLSs with zoomed regions in the vicinity of the period of each planet (S/Nc ~ 13 in Perc ~ 27.67 days and S/Nb ~ 6.22 in Perb ~ 11.57 days, see Table A.2). The transit of planet c was masked before computing the local-BLS spectrum for planet b. In the same figure we present the TESS light curve with the corresponding planet transits (found by the local-BLS) indicated with colors.
In two panels of Fig. 16, we present the phase-folded light curves for each planet from the literature parameters, together with the corresponding models. Both transits appear clearly in the data but with an offset from phase zero, which may be a consequence of the low precision in the determination of TC from RV measurements. Another possible cause could be a timing difference in transit times between the epochs of the HARPS and TESS observations.
 |
Fig. 12 Light curve from TESS photometry of GJ 887. Left panel: data from sector 2 and the right panel shows data from sector 28. Orange lines show the signals detected by global-BLS. Green lines show the signals detected by local-BLS for planet b. |
 |
Fig. 13 Same as Fig. 7 but for planet GJ 887 b except that the parameters are obtained from the local-BLS analysis. |
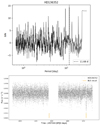 |
Fig. 14 Same as Fig. 5 but for HD 136352. Top panel: shows the Global-BLS periodogram for this target. |
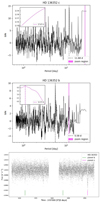 |
Fig. 15 HD 136352 b and c. Top panel: Global-BLS periodogram plus inset showing local-BLS spectrum for planet c. Middle panel: global-BLS periodogram computed masking the signal of planet c plus inset showing local-BLS spectrum for planet b. Dashed vertical black lines indicate the maximum peaks and pink zones point out the regions presented in the insets. Bottom panel: light curve from TESS photometry with green and magenta lines indicating the signal detected by the local-BLS analysis for planets b and c, respectively. |
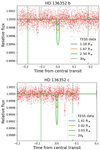 |
Fig. 16 Same as Fig. 7 but for planets HD 136352 b and c. Except that here dashed green lines indicate ±2 or 3 σϕ (as indicated in each figure) as the orbital phase uncertainty. |
6.1.5 HD 158259
HD 158259 is a system with five planets detected by RV data from the SOPHIE spectrograph. The planets have masses between 2 and 6 M⊕, and at least one of them transits its host star (planet b with a period of 2.16 days), and was detected using TESS data by Hara et al. (2020). With the exception of the innermost planet b, all of them are included in our sample. We used data from October 2019 to July 2020 (sectors 17, 20, and 24 through 26). As shown in Table A.2 and Fig. 17, the global-BLS analysis shows a high peak corresponding to the period of planet b. After masking this planet, the BLS spectrum exhibits a moderate peak of the order of the S/N threshold we considered (~6) at a period of 1.37 days, which does not correspond to any of the known planets. This last apparent signal is not clearly visible over the data noise. In Fig. 18 we present the light curves from each TESS sector, with vertical lines indicating the positions of the transits. Also, in Fig. 19 we present this light curve folded in orbital phase using the same parameters; this supports our previous inference that no transit is observed. Figures 20 and 21 present the phase-folded light curves using the parameters of Table A.1 for planets b to f. Planet b exhibits a clear transit, while the others do not.
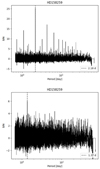 |
Fig. 17 HD 158259. Top panel: Global-BLS periodogram showing a high S/N of transiting known planet b. Bottom panel: Global-BLS masking planet b. Dashed vertical black lines indicate the maximum peak and period respective. |
6.1.6 HD 20794
HD 20794 hosts four RV planets but only one with an orbital period shorter than 30 days. HD 20794 b has a period of 18.32 days (Pepe et al. 2011). TESS observed this star in sectors 3, 4, 30, and 31. In the global-BLS analysis we observed a peak with S/N ~ 11 at around 34 days. On the other hand, the local-BLS periodogram centered at the period of the planet does not exhibit any significant peak (see Fig. 22). Checking the light curve visually (Fig. 23) we noted that the flux drops detected by the global-BLS are often associated with unstable pointing at cadences near momentum dumps (one can be seen near 2 458 430 BTJD) and gaps in the light curves (See Fig. 7 in TESS Data Release Notes of Sector 412). In Fig. 24 we present the folded light curve using the BLS results. The measured 0.007% (70 ppm) depth signal is not reliable. The central cadences of folded curve have a sharp shape that does not resemble a transit. This is mainly due to noisy cadences. In addition, similar features are seen across the orbital phase.
In Fig. 25 we show the phase-folded light curve with literature parameters of planet b (see Table A.1). We can conclude that there is no transit signals of this planet in the TESS data.
 |
Fig. 18 Light curve from TESS photometry of HD 158259. Panels present, from left to right and top to bottom, data from sectors 17, 20, 24, 25, and 26. Orange lines show the signals detected by global-BLS. The light curve is masked to remove the transit of planet b, and the thin gaps in the data are the consequences of this. |
 |
Fig. 19 HD 158259. Folded light curve in a period of 1.37 days from the BLS-spectrum obtained masking cadences corresponding to the transit of planet b. Red points are the TESS data and the dashed line corresponds to the binned flux. |
6.1.7 HD 219134
HD 219134 is a multiplanetary system composed of six planets all detected using the RV technique (Vogt et al. 2015; Motalebi et al. 2015); three of them have periods shorter than 30 days (b, c, and f), but only planet f with a period of 22 days and a minimum mass of 7.3 M⊕ is in our sample because it has not been detected in transit so far (Gillon et al. 2017).
Before computing the global- and local-BLS power spectra, we masked the TESS cadences corresponding to transits of planets b and c (see top panel of Fig. 26). Both BLS periodograms are shown in Fig. 27 and the results are listed in Table A.2. In the global-BLS spectrum we found a peak with S/N ~ 12 at a period of 13.6 days. In the middle panel of Fig. 26, the times of transit for this signal are indicated in the TESS light curve. We can see that one of the detected transits would correspond to a deep drop at the beginning of the observations of sector 17. The signals at the beginning of the observation are not reliable and are usually caused by systematic errors. The second transit is close to noisy cadences just after the downlink data gap (BTJD ~ 2458 778.4) and the two transits of sector 24 are located in data gaps. We recomputed the BLS algorithm discarding the cadences at the beginning of sector 17 (< 1764.75) and obtained a new peak at 10.45 days. Figure 28 presents the light curve folded at that period. The transit has a duration of almost 3.8 hours, which is long for the measured period of 10 days. This, in addition to its irregular shape, leads us to the assumption that the signal is not due to a planetary transit. On the other hand, if we take into account the unknown eccentricity, we obtain that depth (0.008%), period, and duration would be compatible with an eccentricity of e ≳ 0.126. In any case, this system warrants the gathering of further data from other high-precision telescopes such as CHEOPS (Benz et al. 2021) to help confirm or rule out this transit.
Considering the peak seen in the local-BLS spectrum around the period of planet f, the bottom panel of Fig. 26 shows that the cadences that produced the power in the BLS spectrum are located in gaps caused by the previous masked planets. Furthermore, in Fig. 29 we present the transit model superimposed on the phase-folded data using the literature parameters listed in Table A.1. Clearly, the data discard central transits of planets larger than around 1.3 R⊕.
 |
Fig. 23 Light curve from TESS photometry of HD 20794. Left panel: data from sectors 3 and 4 and right panel shows data from sectors 30 and 31. Orange lines show the signals detected by global-BLS. |
 |
Fig. 24 HD 20794. Folded light curve in a period of 34.97 days from the BLS spectrum. Red points are the TESS data and the dashed line corresponds to the binned flux. |
6.1.8 HD 31527
Announced by Udry et al. (2019), HD 31527 is a system with three Neptune-mass planets with periods of 16.6, 51.2, and 271.7 days detected by RV measurements from the HARPS spectrograph. Our sample only includes the innermost planet, HD 31527 b, with a mass of 10.47 M⊕. The host star was observed by TESS in sectors 5 and 32 with a total baseline of 726 days, in two intervals of ~26 days per sector.
The global-BLS spectrum exhibits a peak with S/N ~ 8 at a period of 14.15 days (Fig. 30, Table A.2). The TESS light curve of this star is shown in Fig. 31 and the folded light curve is shown in Fig. 32. All of the putative transits occur close to data gaps (specifically both transits in sector 32 are located in the gaps). In sector 5, the cadences at the end of each orbit are affected by scattered light from Earth. In particular, the cadences at the end of this sector show pointing jitter noise that is caused by a guiding problem (we recommend interested users see Figs. 1 and 3 in the TESS Data Release Notes of the Sector 513). If we apply the BLS-periodogram discarding the latest cadences, the peak disappears and no other significant peak is found. Therefore, we do not consider this a reliable detection. Additionally, the models shown with the TESS light curve phase folded at the period of planet b (Fig. 33) indicate that the data discard transits of planets larger than around 2 R⊕.
6.1.9 HD 40307
HD 40307 is a multiplanetary system detected by RV from the HARPS spectrograph. It has four confirmed planets (Mayor et al. 2009; Díaz et al. 2016), and additional potential planets (Tuomi et al. 2013). Three confirmed planets are included in our sample. These are the super-Earth planets with orbital periods Pb = 4.3, Pc = 9.6, and Pd = 20.5 days. HD 40307 was observed by TESS over 22 sectors (see Table 1) with a full baseline of 980 days approximately.
The global-BLS analysis shows a peak with S/N ~ 7 at a period of 143 days (Fig. 34). The BLS-algorithm placed putative transits in the data gaps between sectors and in cadences with increased instrumental noise in the sectors 30 (momentum dump event near 2 459 122.7 BTJD) and 35 (near 2459 265.9 BTJD, just before the instrument was turned off because of an eclipse).
On the other hand, the local-BLS analyses for individual planets did not yield any significant results (Table A.2). Finally, contrasting with the models calculated using the literature parameters (see Fig. 35), we see that the TESS data clearly discards transits larger than 0.02% for b and c and deeper than 0.03% ford.
 |
Fig. 26 Light curve from TESS photometry of HD 219134. Left panels: data from sector 17. Right panels: data from sector 24. In the top panels, the green and magenta lines show transits of planet b and c, respectively. In the middle panels, orange lines show the signals detected by global-BLS. In the bottom panels, cyan lines point out the signals detected by local-BLS. In the middle and bottom panels, light curves are shown masking the cadences corresponding to the transits of planets b and c. |
 |
Fig. 28 HD 219134. Folded light curve in a period of 10.45 days from the BLS-spectrum obtained discarding first cadences of sector 17. Red points are the TESS data and the dashed line corresponds to the binned flux. |
6.1.10 HD 7924
HD 7924 is a K-type star that hosts three super-Earth planets with periods of 5.39, 15.29, and 24.45 days (Howard et al. 2009; Fulton et al. 2015). All of them are included in our sample. This target was observed by TESS in sectors 18 and 19, making a full baseline of approximately 44 days. In the global-BLS analysis, we obtained a S/N of slightly larger than 10 at a period of 1.004 days (see Fig. 36). By visual inspection of the signals detected by the BLS in the light curve, we noticed a transit with a depth of 40 ppm, which we attributed to instrumental systematic error, because some of the cadences correspond with momentum dumps over the spacecraft. We removed those cadences coinciding with momentum dump events, which are shown in the respective Figs. 7 in the Data Release Notes of sector 1814 and sector 1915, and recomputed the BLS periodogram. We obtained a new period of 3.92 days with a S/N at the limit of our threshold (S/N ~ 6), the duration of the respective transit is almost 6 h with a depth of 0.007% (70 ppm). These parameters are not consistent with a circular orbit, because the duration should be close to 3 hours. Nevertheless, the transit with the measured depth and period would be consistent with a duration of 6 hours if the orbit were to have an eccentricity of e ≳ 0.683.
The models for each planet are shown in Fig. 37. In all cases, the precision would allow the detection of transits of planets as small as around 1.2 R⊕, both in terms of depth and sampling. We conclude that no planetary transits are detected in this target.
6.1.11 tau Cet
tau Cet has been reported to host four planets with masses of less than 4 M⊕ and periods of Pg = 20 , Ph = 49.41, Pe = 162.87, and Pf = 636.13 days (Feng et al. 2017). None of them have been detected in transit, but only planet g was included in our sample because of its period. The BLS spectra exhibit peaks with large S/N ~ 18.9 in 13 days for the global analysis and ~12 in 20 days for the local one (see Table A.2 and Fig. 38).
Checking the data release notes for sectors 3 and 30 (specifically seeing Fig. 616), we note that the light curve produced by the SPOC pipeline for this object is dominated by residual systematic errors. This is seen in the large scatter present in the baseline BLS power. In this way, the signals detected correspond to instrumental effects.
Finally, in Fig. 39 we show the light curve folded with parameters from the literature and the models of possible transits for the measured planetary masses. It is clear that, in spite of the increased systematic errors, the current data would allow the detection of the transits of these planets, at least for the two composition assumptions producing the largest planets.
6.2 Constraints on planetary masses
From the absence of transits, one can put upper limits on the orbital inclination of each planet. Based on the parameters of the systems, and assuming the planets do not transit, we computed the maximum orbital inclination. In Table A.1 we show the inclination angles calculated in two ways: Col. 9 is the maximum possible inclination assuming no transits of any kind – not even grazing – are present (imax) and column 10 is the inclination constraint if only full transits are assumed to be discarded (ifull).
 |
Fig. 31 Light curve from TESS photometry of HD 31527. Left panel: data from sector 5 and the right panel shows data from sector 35. Orange lines show the signals detected by global-BLS. |
 |
Fig. 32 HD 31527. Folded light curve using parameters obtained from the global-BLS with a period of 14.16 days. Red points are the TESS data and the dashed line corresponds to the binned flux. |
7 Summary and discussion
TESS data give us the opportunity to detect transits of Earth-size planets. Here we present the results of a search for transits of a sample of 68 planets detected by RV surveys in 43 systems.
We used TESS photometric data reduced using the processing pipeline developed by the SPOC. We ruled out transits for 66 out of the surveyed 68 planets.
In this work, we wanted to carry out a general exploration using the whole automatically processed data (PDCSAP_FLUX light curves). In the first part, we performed a blind planetary search and a local search for the known planets.
A BLS spectrum was computed for each system using all available sectors. The frequency grid spacing was given by the maximum baseline of observations. In cases such as 61 Vir, GJ 887, and HD 20794, the downlink gaps, together with some photometric systematic effects, introduced false positives in the periodograms. Similarly, the gaps between nonconsecutive sectors produced spurious peaks in the BLS spectrum, such as in the HD 40307 system. To refine this process, it would be useful to produce custom light curves and proceed to explore them sector by sector or simply consider scanning them in consecutive sectors.
For HD 136352, we missed the detection of the two transiting planets in the global-BLS search, although visual inspection revealed the clear transit of planet c. One of the possible reasons for this is the systematic error in the light curve, another is the observational baseline available for this target. On the other hand, targets such as YZ Cet are active cool stars and present flares in their light curves that could hide or weaken the transit signals should they occur and therefore affect the determination of the transit parameters and planet characterization (Bentley et al. 2009; Giacobbe et al. 2012; Loyd & France 2014). To improve the study of this kind of object, it would be necessary to account for the presence of flares when looking for transits.
This topic is treated in a recent work about Proxima Centauri; the authors obtain better results when identifying and modeling the flares using a template, which they then subtract from the data, and perform the transit exploration (Gilbert et al. 2021); similar processes were performed for the AU Mic system by Gilbert et al. (2022) and Szabó et al. (2021).
In the second part of this work, we modeled synthetic transits for every planet in the sample, considering three different radii from compositions following Fortney et al. (2007b; 2007a): pure ice, pure rock, and pure iron composition. These models were used to visually evaluate whether or not such transits could be present in the TESS data. We used these models to check detection limits of each transit, given a maximum and minimum depth and duration for pure ice and pure iron planets, respectively, comparing with the corresponding upper limit radius. This procedure allows us to establish that none of the studied exoplanets are transiting their host star, except for HD 136352 b and c. However, for these two planets, we found a displacement from the literature midpoint. These offsets could be caused by the gravitational interaction between these planets or by the third outer planet “d”, producing a transit timing variation (TTV) signal. In the work of Delrez et al. (2021), a TTV analysis was performed, but the authors did not measure any significant TTV signal. Therefore, we attribute this discrepancy to the low precision of the Doppler method in determining the transit midpoint.
The presence of TTVs in any of the studied systems would certainly affect our ability to detect the transit signals, as they would no longer occur with strict periodicity, and the BLS signal would be degraded. A detailed analysis of the TTVs of these systems is outside the scope of this paper, and we simply assume that there are no timing variations in the studied planets.
Overall, our work allows us to rule out transits for 28 of the 68 planets with radii larger than a pure iron composition radius in our sample, and 51 out of 68 considering a terrestrial planet composition (under the assumption of central transits).
During proof stage, the work of Dalba et al. (2019) was brought to our attention. The authors predict the detection of three transiting planets among RV-detected companions. This number is consistent with our summed geometric transit probabilities of 3.4+/−1.8. In addition, previous work on HD 40307 by Kane et al. (2021) exists that also concludes the planets of the system are not transiting.
 |
Fig. 34 HD 40307. Global-BLS periodogram. Vertical dashed line indicates the maximum peak detected. |
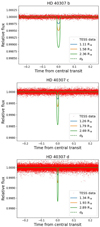 |
Fig. 35 Same as Fig. 7 but for planets HD 40307 b, c, and d. In these cases, the uncertainties of the orbital phases are outside the limits of the plot. |
 |
Fig. 36 HD 7924. Global-BLS periodogram. The vertical dashed line indicates the maximum peak detected. |
 |
Fig. 39 Same as Fig. 7 but for tau Cet g. In this case, the orbital phase uncertainties are outside the limits of the figure. |
Acknowledgements
This research has made use of the NASA Exoplanet Archive, which is operated by the California Institute of Technology, under contract with the National Aeronautics and Space Administration under the Exoplanet Exploration Program. This paper includes data collected by the TESS mission. Funding for the TESS mission is provided by the NASA’s Science Mission Directorate. We acknowledge the use of public TESS data from pipelines at the TESS Science Office and at the TESS Science Processing Operations Center. We also thank the referee for the careful review of the manuscript and for the constructive suggestions and comments, which improved the content and quality of the article.
Appendix A Additional tables
The following tables describe the characteristics of the planets studied in this work. In Table A.1 we list the literature orbital parameters and planetary radii for pure ice, pure rock, and pure iron compositions, in addition to the orbital inclinations obtained in Sects. 5 and 6.2, respectively. In Table A.2 we list the results of the BLS search performed in Sect. 4. Finally, Table A.3 presents the upper detection limits for each target.
Sample of planets studied in this work.
BLS parameters.
Upper limits.
Appendix B BLS transit search figures
This appendix presents the BLS power spectrum of the targets without discussion in previous sections, computed as described in Sect. 4. Each figure shows the results of the global-BLSs, as we mentioned earlier, the GJ 3473, GJ 357 and HD 213885 targets have previously detected transiting planets, so we show the global-BLSs of the masked light curves. The mentioned BLS periodograms are in Figs. B.1, B.2, B.3, B.4 and B.5.
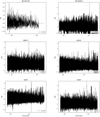 |
Fig. B.1 BLS power spectrum of BD-061339, BD-082823, DMPP-1, GJ 1061, GJ 163 and GJ 180. |
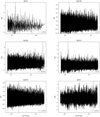 |
Fig. B.2 BLS power spectrum of GJ 273 and GJ 3138, GJ 3293, GJ 3323, GJ 3473 and GJ 357. |
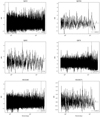 |
Fig. B.3 BLS power spectrum of GJ 433, GJ 676 A, GJ 682, GJ 876, HD 10180 and HD 109271. |
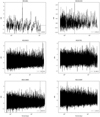 |
Fig. B.4 BLS power spectrum of HD 1461, HD 181433, HD 20003, HD 20781, HD 213885 and HD 215497. |
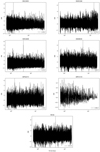 |
Fig. B.5 BLS power spectrum of HD 21693, HD 45184, HD 51608, HD 69830, HIP 54373, HIP 57274 and YZ Cet. |
References
- Astropy Collaboration (Robitaille, T. P., et al.) 2013, A&A, 558, A33 [NASA ADS] [CrossRef] [EDP Sciences] [Google Scholar]
- Astropy Collaboration (Price-Whelan, A. M., et al.) 2018, AJ, 156, 123 [Google Scholar]
- Astudillo-Defru, N., Díaz, R. F., Bonfils, X., et al. 2017a, A&A, 605, L11 [NASA ADS] [CrossRef] [EDP Sciences] [Google Scholar]
- Astudillo-Defru, N., Forveille, T., Bonfils, X., et al. 2017b, A&A, 602, A88 [NASA ADS] [CrossRef] [EDP Sciences] [Google Scholar]
- Batalha, N. M., Rowe, J. F., Gilliland, R. L., et al. 2010, ApJ, 713, L103 [NASA ADS] [CrossRef] [Google Scholar]
- Bentley, S. J., Hellier, C., Maxted, P. F. L., et al. 2009, A&A, 505, 901 [NASA ADS] [CrossRef] [EDP Sciences] [Google Scholar]
- Benz, W., Broeg, C., Fortier, A., et al. 2021, Exp. Astron., 51, 109 [Google Scholar]
- Berta-Thompson, Z. K., Irwin, J., Charbonneau, D., et al. 2015, Nature, 527, 204 [Google Scholar]
- Bonfils, X., Delfosse, X., Udry, S., et al. 2013, A&A, 549, A109 [NASA ADS] [CrossRef] [EDP Sciences] [Google Scholar]
- Bonfils, X., Almenara, J. M., Cloutier, R., et al. 2018, A&A, 618, A142 [NASA ADS] [CrossRef] [EDP Sciences] [Google Scholar]
- Borucki, W. J. 2016, Rep. Prog. Phys., 79, 036901 [Google Scholar]
- Bourrier, V., Dumusque, X., Dorn, C., et al. 2018, A&A, 619, A1 [NASA ADS] [CrossRef] [EDP Sciences] [Google Scholar]
- Brogi, M., Giacobbe, P., Guilluy, G., et al. 2018, A&A, 615, A16 [NASA ADS] [CrossRef] [EDP Sciences] [Google Scholar]
- Campanella, G. 2011, MNRAS, 418, 1028 [NASA ADS] [CrossRef] [Google Scholar]
- Claret, A. 2018, A&A, 618, A20 [NASA ADS] [CrossRef] [EDP Sciences] [Google Scholar]
- Cowan, N. B., Machalek, P., Croll, B., et al. 2012, ApJ, 747, 82 [Google Scholar]
- Dalba, P. A., Kane, S. R., Barclay, T., et al. 2019, PASP, 131, 034401 [CrossRef] [Google Scholar]
- Dawson, R. I., & Fabrycky, D. C. 2010, ApJ, 722, 937 [Google Scholar]
- Delfosse, X., Bonfils, X., Forveille, T., et al. 2013, A&A, 553, A8 [NASA ADS] [CrossRef] [EDP Sciences] [Google Scholar]
- Delrez, L., Ehrenreich, D., Alibert, Y., et al. 2021, Nat. Astron., 5, 775 [NASA ADS] [CrossRef] [Google Scholar]
- Demory, B. O., Gillon, M., Deming, D., et al. 2011, A&A, 533, A114 [NASA ADS] [CrossRef] [EDP Sciences] [Google Scholar]
- Díaz, R. F., Ségransan, D., Udry, S., et al. 2016, A&A, 585, A134Dragomir, D., Matthews, J. M., Eastman, J. D., et al. 2013, ApJ, 772, L2 [Google Scholar]
- Dreizler, S., Jeffers, S. V., Rodríguez, E., et al. 2020, MNRAS, 493, 536 [Google Scholar]
- Dressing, C. D., & Charbonneau, D. 2015, ApJ, 807, 45 [Google Scholar]
- Espinoza, N., Brahm, R., Henning, T., et al. 2020, MNRAS, 491, 2982 [NASA ADS] [Google Scholar]
- Feng, F., Tuomi, M., Jones, H. R. A., et al. 2017, AJ, 154, 135 [Google Scholar]
- Feng, F., Crane, J. D., Xuesong Wang, S., et al. 2019, ApJS, 242, 25 [Google Scholar]
- Feng, F., Butler, R. P., Shectman, S. A., et al. 2020, ApJS, 246, 11 [Google Scholar]
- Fischer, D. A., Gaidos, E., Howard, A. W., et al. 2012, ApJ, 745, 21 [NASA ADS] [CrossRef] [Google Scholar]
- Fortney, J. J., Marley, M. S., & Barnes, J. W. 2007a, ApJ, 668, 1267 [NASA ADS] [CrossRef] [Google Scholar]
- Fortney, J. J., Marley, M. S., & Barnes, J. W. 2007b, ApJ, 659, 1661 [NASA ADS] [CrossRef] [Google Scholar]
- Fulton, B. J., Weiss, L. M., Sinukoff, E., et al. 2015, ApJ, 805, 175 [NASA ADS] [CrossRef] [Google Scholar]
- Giacobbe, P., Damasso, M., Sozzetti, A., et al. 2012, MNRAS, 424, 3101 [CrossRef] [Google Scholar]
- Gilbert, E. A., Barclay, T., Kruse, E., Quintana, E. V., & Walkowicz, L. M. 2021, Front. Astron. Space Sci., 8, 190 [NASA ADS] [CrossRef] [Google Scholar]
- Gilbert, E. A., Barclay, T., Quintana, E. V., et al. 2022, AJ, 163, 147 [NASA ADS] [CrossRef] [Google Scholar]
- Gillon, M., Demory, B.-O., Van Grootel, V., et al. 2017, Nat. Astron., 1, 0056 [Google Scholar]
- Hara, N. C., Bouchy, F., Stalport, M., et al. 2020, A&A, 636, L6 [NASA ADS] [CrossRef] [EDP Sciences] [Google Scholar]
- Hawley, S. L., Gizis, J. E., & Reid, I. N. 1996, AJ, 112, 2799 [Google Scholar]
- Hébrard, G., Udry, S., Lo Curto, G., et al. 2010, A&A, 512, A46 [NASA ADS] [CrossRef] [EDP Sciences] [Google Scholar]
- Howard, A. W., Johnson, J. A., Marcy, G. W., et al. 2009, ApJ, 696, 75 [NASA ADS] [CrossRef] [Google Scholar]
- Howard, A. W., Marcy, G. W., Fischer, D. A., et al. 2014, ApJ, 794, 51 [Google Scholar]
- Jeffers, S. V., Dreizler, S., Barnes, J. R., et al. 2020, Science, 368, 1477 [Google Scholar]
- Jenkins, J. M., Twicken, J. D., McCauliff, S., et al. 2016, SPIE Conf. Ser., 9913, 99133E [Google Scholar]
- Kane, S. R., & Gelino, D. M. 2014, ApJ, 792, 111 [NASA ADS] [CrossRef] [Google Scholar]
- Kane, S. R., Yalçınkaya, S., Osborn, H. P., et al. 2020, AJ, 160, 129 [NASA ADS] [CrossRef] [Google Scholar]
- Kane, S. R., Bean, J. L., Campante, T. L., et al. 2021, PASP, 133, 014402 [NASA ADS] [CrossRef] [Google Scholar]
- Kemmer, J., Stock, S., Kossakowski, D., et al. 2020, A&A, 642, A236 [EDP Sciences] [Google Scholar]
- Kovács, G., Zucker, S., & Mazeh, T. 2002, A&A, 391, 369 [Google Scholar]
- Kreidberg, L. 2015, PASP, 127, 1161 [Google Scholar]
- Lightkurve Collaboration (Cardoso, J. V. D. M., et al.) 2018, Astrophysics Source Code Library [record ascl:1812.013] [Google Scholar]
- Lissauer, J. J., Fabrycky, D. C., Ford, E. B., et al. 2011, Nature, 470, 53 [Google Scholar]
- Lissauer, J. J., Dawson, R. I., & Tremaine, S. 2014, Nature, 513, 336 [Google Scholar]
- Livingston, J. H., Endl, M., Dai, F., et al. 2018, AJ, 156, 78 [Google Scholar]
- Lo Curto, G., Mayor, M., Benz, W., et al. 2010, A&A, 512, A48 [NASA ADS] [CrossRef] [EDP Sciences] [Google Scholar]
- Lo Curto, G., Mayor, M., Benz, W., et al. 2013, A&A, 551, A59 [NASA ADS] [CrossRef] [EDP Sciences] [Google Scholar]
- Lovis, C., Mayor, M., Pepe, F., et al. 2006, Nature, 441, 305 [NASA ADS] [CrossRef] [Google Scholar]
- Lovis, C., Ségransan, D., Mayor, M., et al. 2011, A&A, 528, A112 [NASA ADS] [CrossRef] [EDP Sciences] [Google Scholar]
- Loyd, R. O. P., & France, K. 2014, ApJS, 211, 9 [NASA ADS] [CrossRef] [Google Scholar]
- Luque, R., Pallé, E., Kossakowski, D., et al. 2019, A&A, 628, A39 [NASA ADS] [CrossRef] [EDP Sciences] [Google Scholar]
- Mayor, M., Pepe, F., Queloz, D., et al. 2003, The Messenger, 114, 20 [NASA ADS] [Google Scholar]
- Mayor, M., Udry, S., Lovis, C., et al. 2009, A&A, 493, 639 [NASA ADS] [CrossRef] [EDP Sciences] [Google Scholar]
- McArthur, B. E., Endl, M., Cochran, W. D., et al. 2004, ApJ, 614, L81 [Google Scholar]
- Motalebi, F., Udry, S., Gillon, M., et al. 2015, A&A, 584, A72 [NASA ADS] [CrossRef] [EDP Sciences] [Google Scholar]
- Moutou, C., Almenara, J.-M., Alonso, R., et al. 2011, unpublished Ofir, A. 2014, A&A, 561, A138 [CrossRef] [EDP Sciences] [Google Scholar]
- Pepe, F., Lovis, C., Ségransan, D., et al. 2011, A&A, 534, A58 [CrossRef] [EDP Sciences] [Google Scholar]
- Pepper, J., Kane, S. R., Rodriguez, J. E., et al. 2020, AJ, 159, 243 [Google Scholar]
- Pinamonti, M., Damasso, M., Marzari, F., et al. 2018, A&A, 617, A104 [NASA ADS] [CrossRef] [EDP Sciences] [Google Scholar]
- Pont, F., Zucker, S., & Queloz, D. 2006, MNRAS, 373, 231 [NASA ADS] [CrossRef] [Google Scholar]
- Ricker, G. R., Winn, J. N., Vanderspek, R., et al. 2015, J. Astron. Teles. Instrume. Syst., 1, 014003 [Google Scholar]
- Rivera, E. J., Laughlin, G., Butler, R. P., et al. 2010, ApJ, 719, 890 [Google Scholar]
- Sahlmann, J., Lazorenko, P. F., Ségransan, D., et al. 2016, A&A, 595, A77 [NASA ADS] [CrossRef] [EDP Sciences] [Google Scholar]
- Sánchez-López, A., Alonso-Floriano, F. J., López-Puertas, M., et al. 2019, A&A, 630, A53 [NASA ADS] [CrossRef] [EDP Sciences] [Google Scholar]
- Savitzky, A., & Golay, M. J. E. 1964, Anal. Chem., 36, 1627 [Google Scholar]
- Seager, S., & Deming, D. 2010, ARA&A, 48, 631 [NASA ADS] [CrossRef] [Google Scholar]
- Seager, S., Kuchner, M., Hier-Majumder, C. A., & Militzer, B. 2007, ApJ, 669, 1279 [NASA ADS] [CrossRef] [Google Scholar]
- Staab, D., Haswell, C. A., Barnes, J. R., et al. 2020, Nat. Astron., 4, 399 [NASA ADS] [CrossRef] [Google Scholar]
- Stassun, K. G., Collins, K. A., & Gaudi, B. S. 2017, AJ, 153, 136 [Google Scholar]
- Stassun, K. G., Oelkers, R. J., Paegert, M., et al. 2019, AJ, 158, 138 [Google Scholar]
- Szabó, G. M., Gandolfi, D., Brandeker, A., et al. 2021, A&A, 654, A159 [NASA ADS] [CrossRef] [EDP Sciences] [Google Scholar]
- Tuomi, M., Jones, H. R. A., Jenkins, J. S., et al. 2013, A&A, 551, A79 [NASA ADS] [CrossRef] [EDP Sciences] [Google Scholar]
- Tuomi, M., Jones, H. R. A., Barnes, J. R., Anglada-Escudé, G., & Jenkins, J. S. 2014, MNRAS, 441, 1545 [Google Scholar]
- Turnbull, M. C. 2015, ArXiv e-prints [arXiv: 1510.01731] [Google Scholar]
- Udry, S., Dumusque, X., Lovis, C., et al. 2019, A&A, 622, A37 [NASA ADS] [CrossRef] [EDP Sciences] [Google Scholar]
- Valencia, D., O’Connell, R. J., & Sasselov, D. 2006, Icarus, 181, 545 [Google Scholar]
- Vogt, S. S., Wittenmyer, R. A., Butler, R. P., et al. 2010, ApJ, 708, 1366 [NASA ADS] [CrossRef] [Google Scholar]
- Vogt, S. S., Burt, J., Meschiari, S., et al. 2015, ApJ, 814, 12 [NASA ADS] [CrossRef] [Google Scholar]
- Winn, J. N., Matthews, J. M., Dawson, R. I., et al. 2011, ApJ, 737, L18 [Google Scholar]
- Wong, I., Knutson, H. A., Kataria, T., et al. 2016, ApJ, 823, 122 [NASA ADS] [CrossRef] [Google Scholar]
- Wong, I., Shporer, A., Daylan, T., et al. 2020, AJ, 160, 155 [Google Scholar]
Lightkurve is a Python package for Kepler and TESS data analysis (Lightkurve Collaboration 2018).
Data release notes of TESS observed sectors: https://archive.stsci.edu/tess/tess_drn.html
This research made use of Astropy (http://www.astropy.org) a community-developed core Python package for Astronomy (Astropy Collaboration 2013, 2018).
TESS data release notes: https://archive.stsci.edu/tess/tess_drn.html
All Tables
All Figures
 |
Fig. 1 Planet minimum mass vs. orbital period. The color scale corresponds to the spectral types of the host stars, and the sizes are proportional to |
| In the text | |
 |
Fig. 2 Root mean square for normalized light curves from three host stars of the sample, binned at various intervals (pink curve). The black line indicates the expected standard deviation, assuming pure additive Gaussian white noise, which scales as |
| In the text | |
 |
Fig. 3 BLS power periodogram. The global-BLS is in black. The inset on the upper left corner shows the period range of the pink shadowed zone. Dashed vertical lines point out maximum peaks in both ranges of exploration. Left panel: global-BLS analysis for star GJ 1132 without masking the data before the run; the highest peak is detected at the period of the known transiting planet. Right panel: global- and Local-BLS spectra computed using masked data; the latter explores the range of periods corresponding to the RV-detected planet GJ 1132 c. |
| In the text | |
 |
Fig. 4 55 Cnc e. Left: BLS periodogram, dashed vertical black line indicates the maximum peak. Middle: transit model plus light curve folded with BLS results. Right: transit model plus light curve folded with literature parameters. Solid lines of different colors correspond to models for different radii (green for Rice, orange for Rrock and blue for Riron), green dashed vertical lines indicate ±σϕ, the orbital phase uncertainty. |
| In the text | |
 |
Fig. 5 61 Vir. Top: global-BLS periodogram plus inset with a local-BLS spectrum. Dashed vertical black line indicates the maximum peak and period respective, and pink zone points out the region of the local-BLS analysis. Bottom: light curve from TESS photometry. Orange lines show the signals detected by global-BLS. |
| In the text | |
 |
Fig. 6 61 Vir. Light curve folded at a period of 1.49 days, detected from the BLS-spectrum obtained discarding cadences at <1571.05 days. Red points are the TESS data and the dashed line corresponds to the binned flux. |
| In the text | |
 |
Fig. 7 61 Vir b. Transit model plus light curve folded with literature parameters. Red points are the TESS data binned. Solid lines of different colors correspond to models for different radii (green for Rice, orange for Rrock and blue for Riron), and the dashed green lines indicate ±σø, the orbital phase uncertainty. |
| In the text | |
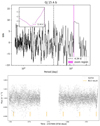 |
Fig. 8 Same as Fig. 5 but for GJ 15 A. |
| In the text | |
 |
Fig. 9 GJ 15 A. Folded light curve with a period of 1.3 days obtained from the BLS spectrum after discarding final cadences of sector 17. Red points are the TESS data and the dashed line corresponds to the binned flux. |
| In the text | |
 |
Fig. 10 Same as Fig. 7 but for GJ 15 A b. |
| In the text | |
 |
Fig. 11 GJ 887. Global-BLS periodogram plus a small box with a zoom region showing the local-BLS for planet b. The dashed vertical black line indicates the maximum peak and respective period, and the pink zone points out the zoomed-in region shown in the small box. |
| In the text | |
 |
Fig. 12 Light curve from TESS photometry of GJ 887. Left panel: data from sector 2 and the right panel shows data from sector 28. Orange lines show the signals detected by global-BLS. Green lines show the signals detected by local-BLS for planet b. |
| In the text | |
 |
Fig. 13 Same as Fig. 7 but for planet GJ 887 b except that the parameters are obtained from the local-BLS analysis. |
| In the text | |
 |
Fig. 14 Same as Fig. 5 but for HD 136352. Top panel: shows the Global-BLS periodogram for this target. |
| In the text | |
 |
Fig. 15 HD 136352 b and c. Top panel: Global-BLS periodogram plus inset showing local-BLS spectrum for planet c. Middle panel: global-BLS periodogram computed masking the signal of planet c plus inset showing local-BLS spectrum for planet b. Dashed vertical black lines indicate the maximum peaks and pink zones point out the regions presented in the insets. Bottom panel: light curve from TESS photometry with green and magenta lines indicating the signal detected by the local-BLS analysis for planets b and c, respectively. |
| In the text | |
 |
Fig. 16 Same as Fig. 7 but for planets HD 136352 b and c. Except that here dashed green lines indicate ±2 or 3 σϕ (as indicated in each figure) as the orbital phase uncertainty. |
| In the text | |
 |
Fig. 17 HD 158259. Top panel: Global-BLS periodogram showing a high S/N of transiting known planet b. Bottom panel: Global-BLS masking planet b. Dashed vertical black lines indicate the maximum peak and period respective. |
| In the text | |
 |
Fig. 18 Light curve from TESS photometry of HD 158259. Panels present, from left to right and top to bottom, data from sectors 17, 20, 24, 25, and 26. Orange lines show the signals detected by global-BLS. The light curve is masked to remove the transit of planet b, and the thin gaps in the data are the consequences of this. |
| In the text | |
 |
Fig. 19 HD 158259. Folded light curve in a period of 1.37 days from the BLS-spectrum obtained masking cadences corresponding to the transit of planet b. Red points are the TESS data and the dashed line corresponds to the binned flux. |
| In the text | |
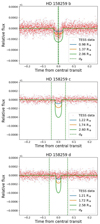 |
Fig. 20 Same as Fig. 7 but for planets HD 158259 b, c and d. |
| In the text | |
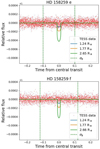 |
Fig. 21 Same as Fig. 7 but for planets HD 158259 e and f. |
| In the text | |
 |
Fig. 22 Same as Fig. 11 but for HD 20794 b. |
| In the text | |
 |
Fig. 23 Light curve from TESS photometry of HD 20794. Left panel: data from sectors 3 and 4 and right panel shows data from sectors 30 and 31. Orange lines show the signals detected by global-BLS. |
| In the text | |
 |
Fig. 24 HD 20794. Folded light curve in a period of 34.97 days from the BLS spectrum. Red points are the TESS data and the dashed line corresponds to the binned flux. |
| In the text | |
 |
Fig. 25 Same as Fig. 7 but for HD 20794 b. |
| In the text | |
 |
Fig. 26 Light curve from TESS photometry of HD 219134. Left panels: data from sector 17. Right panels: data from sector 24. In the top panels, the green and magenta lines show transits of planet b and c, respectively. In the middle panels, orange lines show the signals detected by global-BLS. In the bottom panels, cyan lines point out the signals detected by local-BLS. In the middle and bottom panels, light curves are shown masking the cadences corresponding to the transits of planets b and c. |
| In the text | |
 |
Fig. 27 Same as Fig. 11 but for HD 219134 f. |
| In the text | |
 |
Fig. 28 HD 219134. Folded light curve in a period of 10.45 days from the BLS-spectrum obtained discarding first cadences of sector 17. Red points are the TESS data and the dashed line corresponds to the binned flux. |
| In the text | |
 |
Fig. 29 Same as Fig. 7 but for HD 219134 f. |
| In the text | |
 |
Fig. 30 Same as Fig. 11 but for HD 31527 b. |
| In the text | |
 |
Fig. 31 Light curve from TESS photometry of HD 31527. Left panel: data from sector 5 and the right panel shows data from sector 35. Orange lines show the signals detected by global-BLS. |
| In the text | |
 |
Fig. 32 HD 31527. Folded light curve using parameters obtained from the global-BLS with a period of 14.16 days. Red points are the TESS data and the dashed line corresponds to the binned flux. |
| In the text | |
 |
Fig. 33 Same as Fig. 7 but for HD 31527 b. |
| In the text | |
 |
Fig. 34 HD 40307. Global-BLS periodogram. Vertical dashed line indicates the maximum peak detected. |
| In the text | |
 |
Fig. 35 Same as Fig. 7 but for planets HD 40307 b, c, and d. In these cases, the uncertainties of the orbital phases are outside the limits of the plot. |
| In the text | |
 |
Fig. 36 HD 7924. Global-BLS periodogram. The vertical dashed line indicates the maximum peak detected. |
| In the text | |
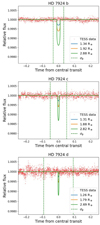 |
Fig. 37 Same as Fig. 7 but for planets HD 7924 b, c and d. |
| In the text | |
 |
Fig. 38 Same as Fig. 11 but for tau Cet g. |
| In the text | |
 |
Fig. 39 Same as Fig. 7 but for tau Cet g. In this case, the orbital phase uncertainties are outside the limits of the figure. |
| In the text | |
 |
Fig. B.1 BLS power spectrum of BD-061339, BD-082823, DMPP-1, GJ 1061, GJ 163 and GJ 180. |
| In the text | |
 |
Fig. B.2 BLS power spectrum of GJ 273 and GJ 3138, GJ 3293, GJ 3323, GJ 3473 and GJ 357. |
| In the text | |
 |
Fig. B.3 BLS power spectrum of GJ 433, GJ 676 A, GJ 682, GJ 876, HD 10180 and HD 109271. |
| In the text | |
 |
Fig. B.4 BLS power spectrum of HD 1461, HD 181433, HD 20003, HD 20781, HD 213885 and HD 215497. |
| In the text | |
 |
Fig. B.5 BLS power spectrum of HD 21693, HD 45184, HD 51608, HD 69830, HIP 54373, HIP 57274 and YZ Cet. |
| In the text | |
Current usage metrics show cumulative count of Article Views (full-text article views including HTML views, PDF and ePub downloads, according to the available data) and Abstracts Views on Vision4Press platform.
Data correspond to usage on the plateform after 2015. The current usage metrics is available 48-96 hours after online publication and is updated daily on week days.
Initial download of the metrics may take a while.


