Fig. 15
Download original image
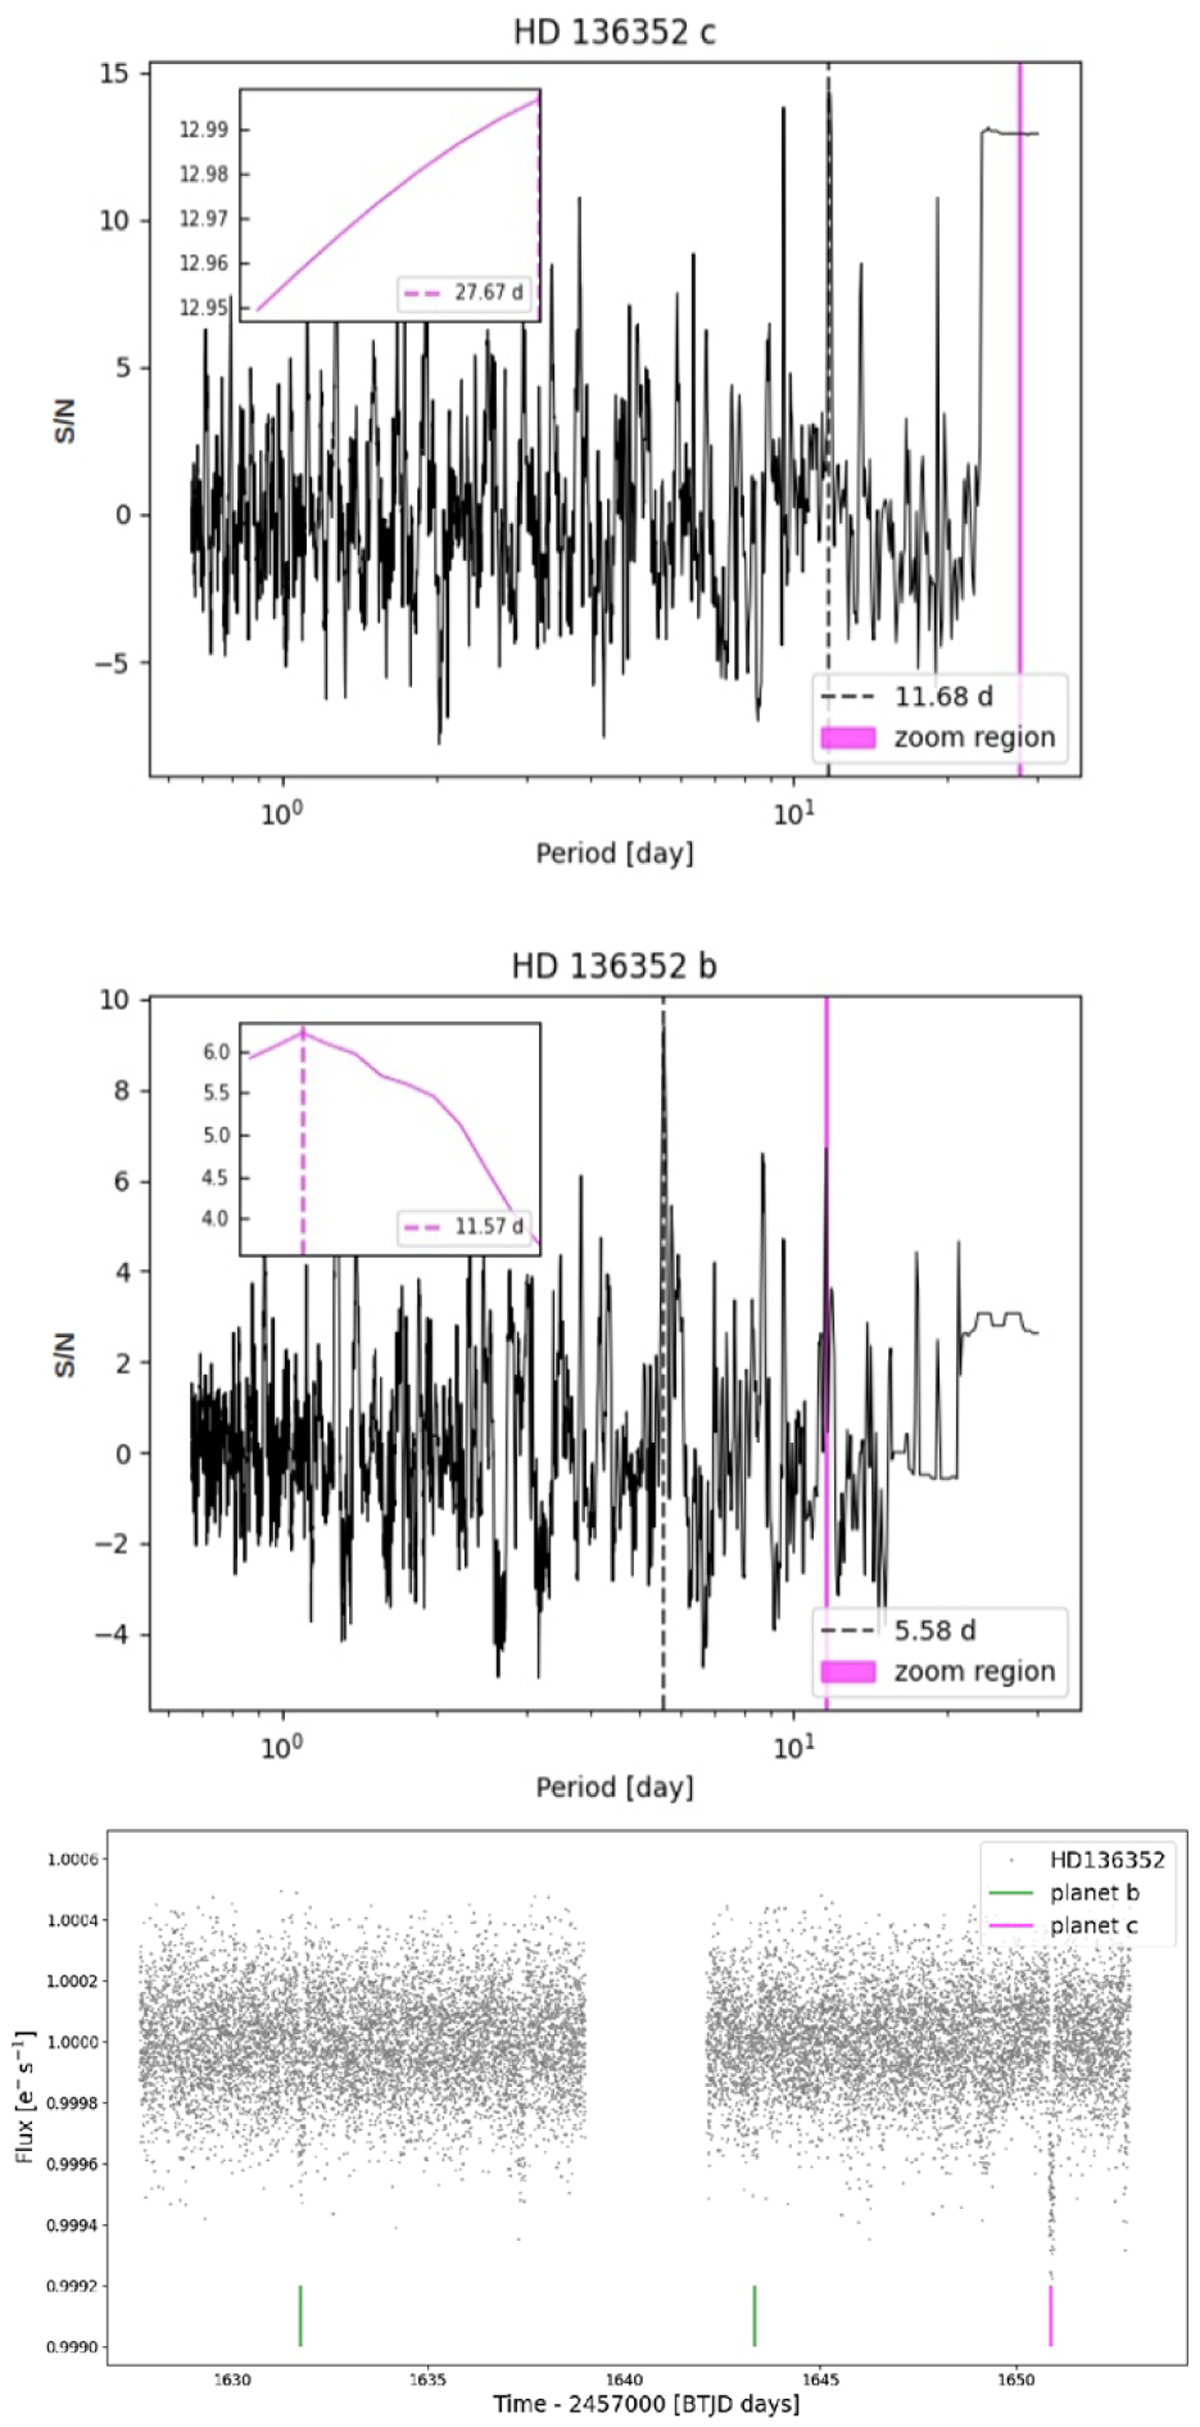
HD 136352 b and c. Top panel: Global-BLS periodogram plus inset showing local-BLS spectrum for planet c. Middle panel: global-BLS periodogram computed masking the signal of planet c plus inset showing local-BLS spectrum for planet b. Dashed vertical black lines indicate the maximum peaks and pink zones point out the regions presented in the insets. Bottom panel: light curve from TESS photometry with green and magenta lines indicating the signal detected by the local-BLS analysis for planets b and c, respectively.
Current usage metrics show cumulative count of Article Views (full-text article views including HTML views, PDF and ePub downloads, according to the available data) and Abstracts Views on Vision4Press platform.
Data correspond to usage on the plateform after 2015. The current usage metrics is available 48-96 hours after online publication and is updated daily on week days.
Initial download of the metrics may take a while.