Open Access
Fig. 12
Download original image
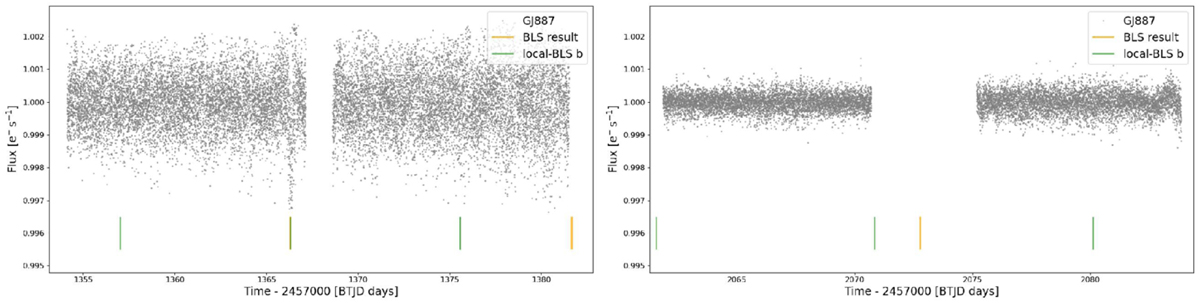
Light curve from TESS photometry of GJ 887. Left panel: data from sector 2 and the right panel shows data from sector 28. Orange lines show the signals detected by global-BLS. Green lines show the signals detected by local-BLS for planet b.
Current usage metrics show cumulative count of Article Views (full-text article views including HTML views, PDF and ePub downloads, according to the available data) and Abstracts Views on Vision4Press platform.
Data correspond to usage on the plateform after 2015. The current usage metrics is available 48-96 hours after online publication and is updated daily on week days.
Initial download of the metrics may take a while.