Open Access
Fig. 11
Download original image
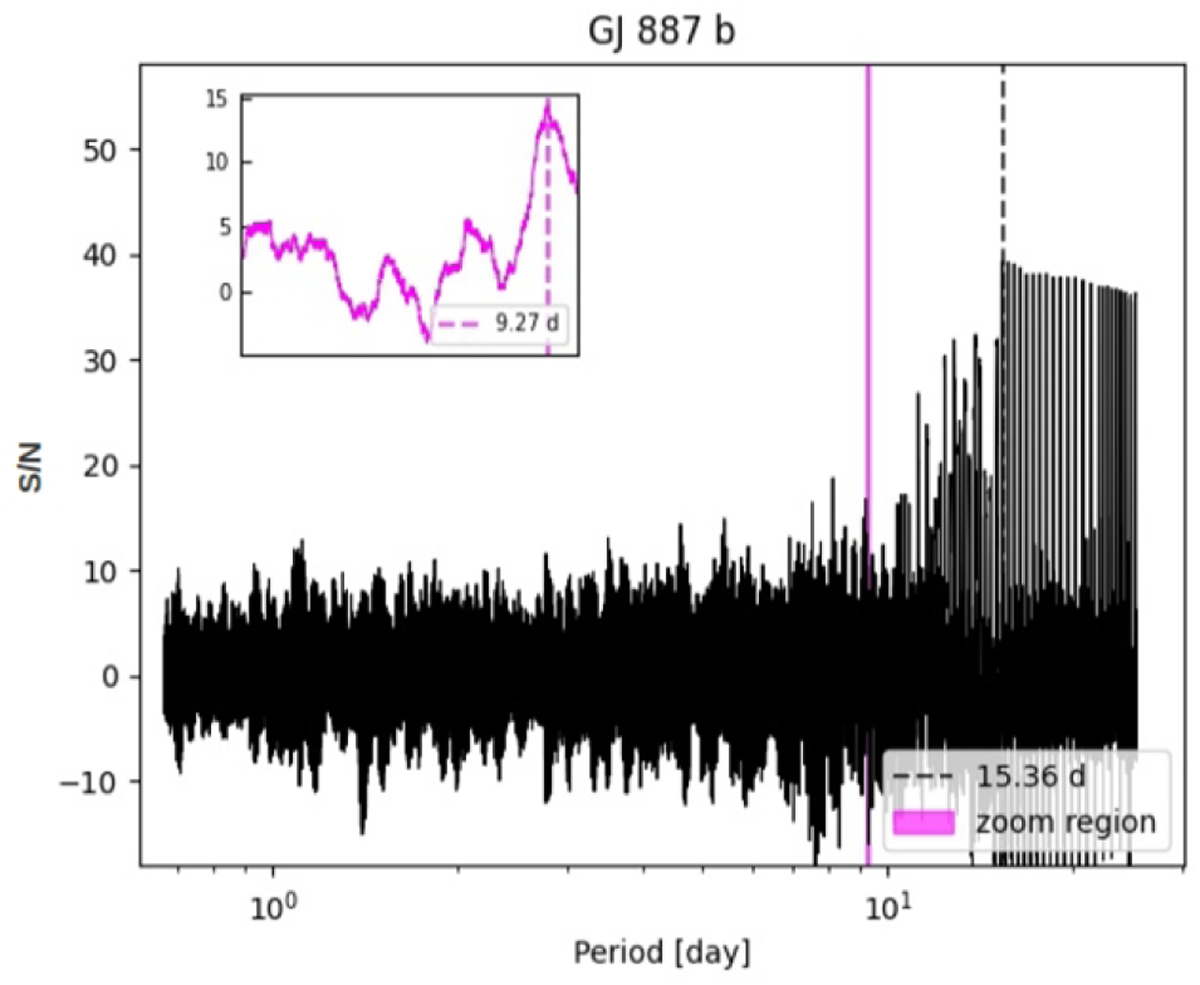
GJ 887. Global-BLS periodogram plus a small box with a zoom region showing the local-BLS for planet b. The dashed vertical black line indicates the maximum peak and respective period, and the pink zone points out the zoomed-in region shown in the small box.
Current usage metrics show cumulative count of Article Views (full-text article views including HTML views, PDF and ePub downloads, according to the available data) and Abstracts Views on Vision4Press platform.
Data correspond to usage on the plateform after 2015. The current usage metrics is available 48-96 hours after online publication and is updated daily on week days.
Initial download of the metrics may take a while.