Fig. 4
Download original image
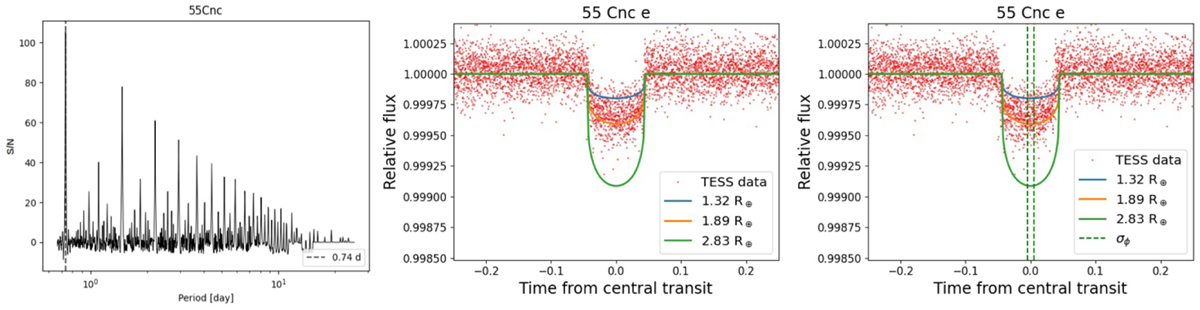
55 Cnc e. Left: BLS periodogram, dashed vertical black line indicates the maximum peak. Middle: transit model plus light curve folded with BLS results. Right: transit model plus light curve folded with literature parameters. Solid lines of different colors correspond to models for different radii (green for Rice, orange for Rrock and blue for Riron), green dashed vertical lines indicate ±σϕ, the orbital phase uncertainty.
Current usage metrics show cumulative count of Article Views (full-text article views including HTML views, PDF and ePub downloads, according to the available data) and Abstracts Views on Vision4Press platform.
Data correspond to usage on the plateform after 2015. The current usage metrics is available 48-96 hours after online publication and is updated daily on week days.
Initial download of the metrics may take a while.