Fig. 2
Download original image
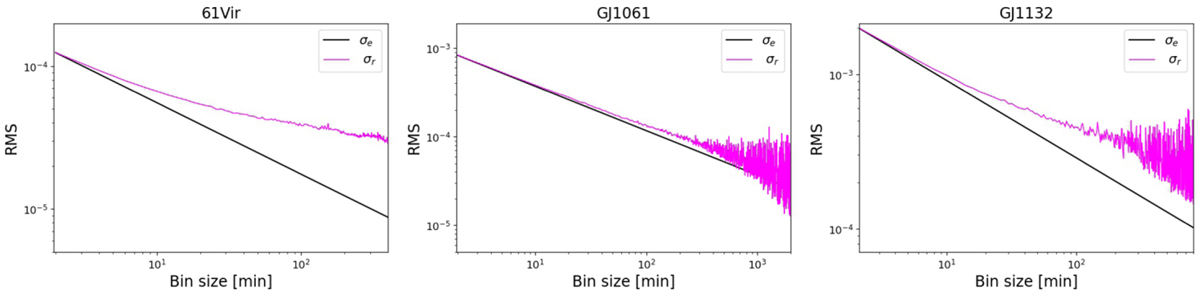
Root mean square for normalized light curves from three host stars of the sample, binned at various intervals (pink curve). The black line indicates the expected standard deviation, assuming pure additive Gaussian white noise, which scales as ![]() The deviation of the pink curve from the black line indicates the presence of correlated red noise at the corresponding timescales. Left panel: 61 Vir has a Tmag = 4.08. Middle panel: GJ 1061 has a Tmag = 9.47. Right panel: GJ 1132 has a Tmag = 12.14.
The deviation of the pink curve from the black line indicates the presence of correlated red noise at the corresponding timescales. Left panel: 61 Vir has a Tmag = 4.08. Middle panel: GJ 1061 has a Tmag = 9.47. Right panel: GJ 1132 has a Tmag = 12.14.
Current usage metrics show cumulative count of Article Views (full-text article views including HTML views, PDF and ePub downloads, according to the available data) and Abstracts Views on Vision4Press platform.
Data correspond to usage on the plateform after 2015. The current usage metrics is available 48-96 hours after online publication and is updated daily on week days.
Initial download of the metrics may take a while.