Fig. 3
Download original image
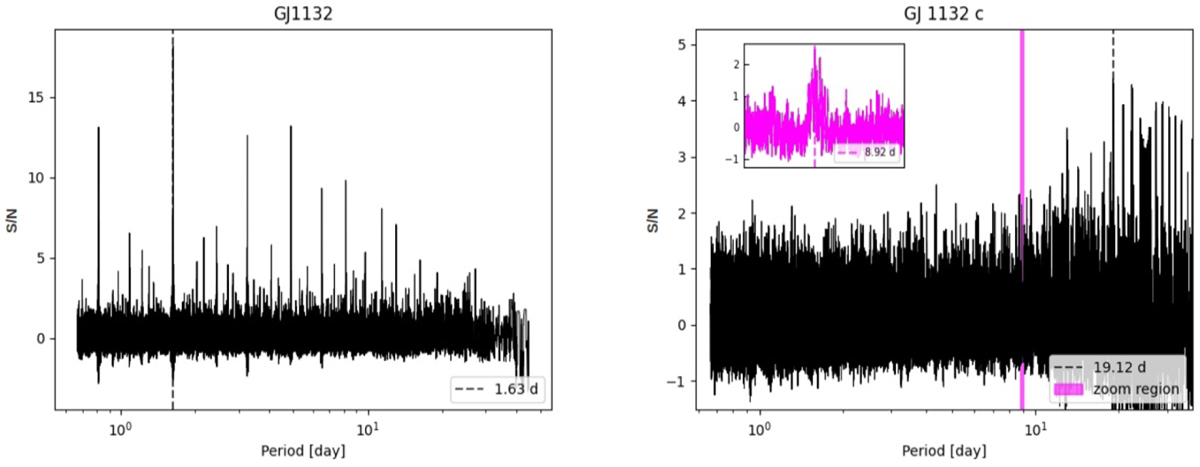
BLS power periodogram. The global-BLS is in black. The inset on the upper left corner shows the period range of the pink shadowed zone. Dashed vertical lines point out maximum peaks in both ranges of exploration. Left panel: global-BLS analysis for star GJ 1132 without masking the data before the run; the highest peak is detected at the period of the known transiting planet. Right panel: global- and Local-BLS spectra computed using masked data; the latter explores the range of periods corresponding to the RV-detected planet GJ 1132 c.
Current usage metrics show cumulative count of Article Views (full-text article views including HTML views, PDF and ePub downloads, according to the available data) and Abstracts Views on Vision4Press platform.
Data correspond to usage on the plateform after 2015. The current usage metrics is available 48-96 hours after online publication and is updated daily on week days.
Initial download of the metrics may take a while.