Fig. 26
Download original image
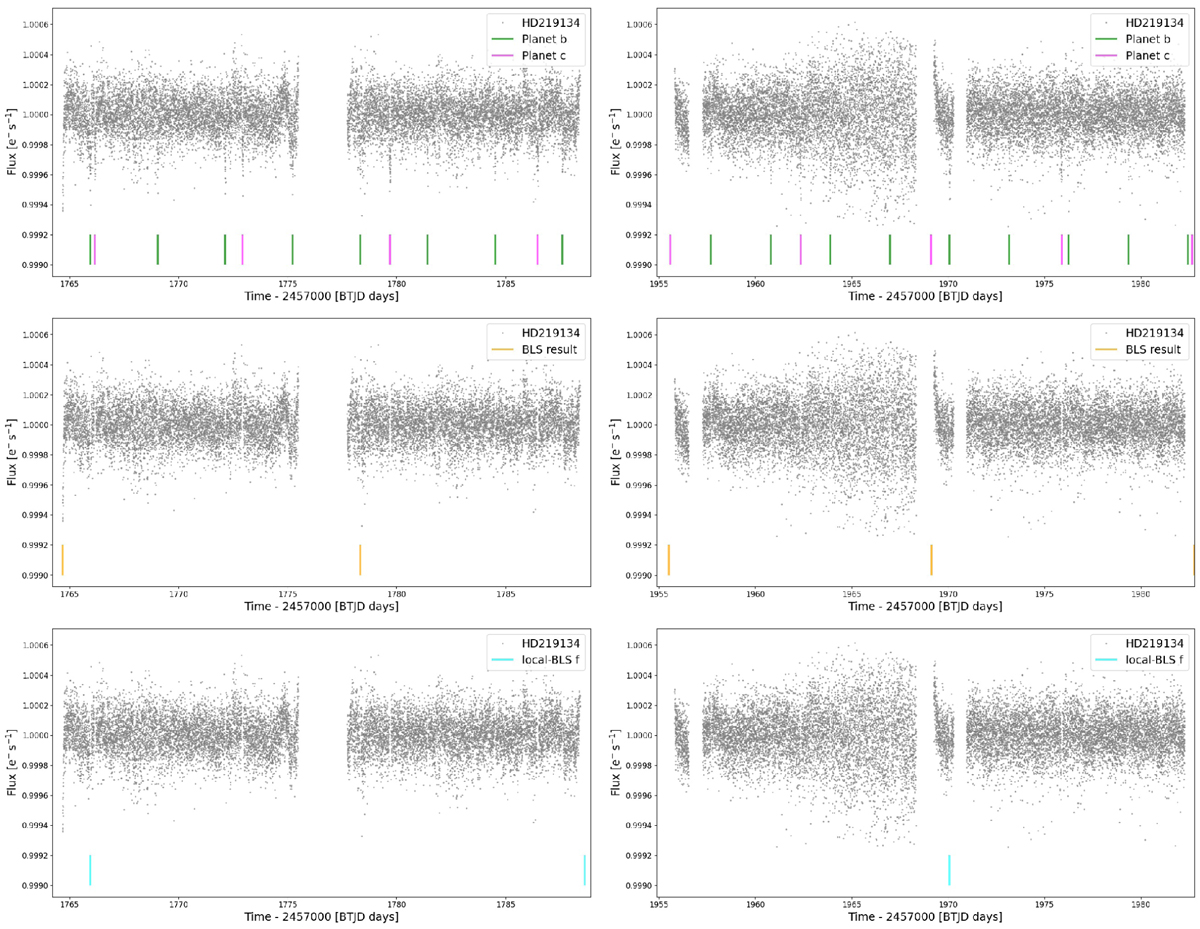
Light curve from TESS photometry of HD 219134. Left panels: data from sector 17. Right panels: data from sector 24. In the top panels, the green and magenta lines show transits of planet b and c, respectively. In the middle panels, orange lines show the signals detected by global-BLS. In the bottom panels, cyan lines point out the signals detected by local-BLS. In the middle and bottom panels, light curves are shown masking the cadences corresponding to the transits of planets b and c.
Current usage metrics show cumulative count of Article Views (full-text article views including HTML views, PDF and ePub downloads, according to the available data) and Abstracts Views on Vision4Press platform.
Data correspond to usage on the plateform after 2015. The current usage metrics is available 48-96 hours after online publication and is updated daily on week days.
Initial download of the metrics may take a while.