| Issue |
A&A
Volume 660, April 2022
|
|
|---|---|---|
| Article Number | A93 | |
| Number of page(s) | 22 | |
| Section | Extragalactic astronomy | |
| DOI | https://doi.org/10.1051/0004-6361/202142911 | |
| Published online | 14 April 2022 | |
The LOFAR view of giant, early-type galaxies: Radio emission from active nuclei and star formation
1
INAF – Osservatorio Astrofisico di Torino, Strada Osservatorio 20, 10025 Pino Torinese, Italy
e-mail: This email address is being protected from spambots. You need JavaScript enabled to view it.
2
Dipartimento di Fisica e Astronomia, Università di Bologna, Via P. Gobetti 93/2, 40129 Bologna, Italy
3
INAF – Istituto di Radio Astronomia, Via P. Gobetti 101, 40129 Bologna, Italy
4
SUPA, Institute for Astronomy, Royal Observatory, Blackford Hill, Edinburgh EH9 3HJ, UK
5
Thüringer Landessternwarte, Sternwarte 5, 07778 Tautenburg, Germany
6
Leiden Observatory, Leiden University, PO Box 9513 2300 RA Leiden, The Netherlands
7
GEPI & USN, Observatoire de Paris, Université PSL, CNRS, 5 Place Jules Janssen, 92190 Meudon, France
8
Department of Physics & Electronics, Rhodes University, PO Box 94 Grahamstown 6140, South Africa
9
The Open University, Walton Hall, Milton Keynes MK7 6AA, UK
Received:
14
December
2021
Accepted:
8
February
2022
Abstract
We studied the properties and the origin of the radio emission in the most luminous, early-type galaxies (ETGs) in the nearby Universe (MK ≤ −25, recession velocity ≤7500 km s−1), as seen by the 150 MHz Low-Frequency ARray (LOFAR) observations. LOFAR images are available for 188 of these giant ETGs (gETGs), and 146 (78%) of them are detected above a typical luminosity of ∼1021 W Hz−1. They show a large spread in power, reaching up to ∼1026 W Hz−1. We confirm a positive link between the stellar luminosity of gETGs and their median radio power, the detection rate, and the fraction of extended sources. About two-thirds (91) of the detected gETGs are unresolved, with sizes ≲4 kpc, confirming the prevalence of compact radio sources in local sources. Forty-six gETGs show extended emission on scales ranging from 4 to 340 kpc, at least 80% of which have a FR I class morphology. Based on the morphology and spectral index of the extended sources, ∼30% of them might be remnant or restarted sources, but further studies are needed to confirm this. Optical spectroscopy (available for 44 gETGs) indicates that for seven gETGs the nuclear gas is ionized by young stars suggesting a contribution to their radio emission from star forming regions. Their radio luminosities correspond to a star formation rate (SFR) in the range 0.1−8 M⊙ yr−1 and a median specific SFR of 0.8 × 10⁻¹² yr−1. The gas flowing toward the center of gETGs can accrete onto the supermassive black hole but also stall at larger radii and form new stars, an indication that feedback does not completely quench star formation. The most luminous gETGs (25 galaxies with MK < −25.8) are all detected at 150 MHz; however, they are not all currently turned on: at least four of them are remnant sources and at least one is likely powered by star formation.
Key words: galaxies: active / galaxies: elliptical and lenticular, cD / galaxies: jets
© ESO 2022
1. Introduction
Feedback from active galactic nuclei (AGNs) is an important ingredient in the evolution of galaxies. For example, the transfer of energy and matter from relativistic jets to the external medium, the so-called radio mode feedback (e.g., Fabian 2012), is thought to be able to quench star formation and produce the exponential cut-off at the bright end of the galaxy luminosity function (Croton et al. 2006). Exploring the properties and the origin of the radio emission in the most massive galaxies is an essential step to understanding how this process operates. In particular, it is necessary to separate sources in which the radio emission is produced by an AGN from those powered by star formation in order to study their morphology and to explore their duty-cycle.
The study of the radio emission in early-type galaxies (ETGs) has been the subject of many studies in the past (e.g., Ekers & Ekers 1973; Colla et al. 1975; Fanti et al. 1978; Sadler et al. 1989; Wrobel 1991; Wrobel & Heeschen 1991). The general conclusions have been the large fraction of ETGs associated with radio sources, the positive dependence of radio power with the luminosity of the host, and the large spread of radio luminosity at a given host mass.
A significant issue for these studies is the ability to separate radio emission produced by AGN and star forming regions, a process that becomes dominant at low power (Condon et al. 2002). This is best obtained from the optical spectra of these sources and the large area surveys obtained in the last decades provided us with required information on both the radio and the optical.
Best et al. (2005a) studied a sample of 2215 radio-loud AGN with 0.03 < z < 0.3 obtained by combining data from the Faint Images of the Radio Sky at Twenty centimeters survey (FIRST, Becker et al. 1995; Helfand et al. 2015), the National Radio Astronomy Observatory Very Large Array Sky Survey (NVSS, Condon et al. 1998), and spectra of galaxies included in the main galaxy spectroscopic sample of the Sloan Digital Survey (SDSS, York et al. 2000). They confirmed the link between radio source prevalence and host luminosity derived from previous studies: the integral radio luminosity function is well described with a broken power law whose normalization grows with the stellar mass as  and the AGN fraction is as high as 30% in the most massive galaxies.
Mauch & Sadler (2007) identified 7824 radio sources in the NVSS in the six-degree Field Galaxy Survey (Jones et al. 2004) associated with galaxies brighter than K = 12.75 mag, spanning the 0.003 < z < 0.3 range. They separated radio sources powered by star formation and AGNs and found that radio-loud AGNs are preferentially hosted by the most massive galaxies.
Shabala et al. (2008) found, by combining SDSS, FIRST, and NVSS data, that the length of the active phase has a strong dependence on the host mass. The active phase length is connected with the gas cooling rate, suggesting the quiescent phase is due to fuel depletion.
The analysis of a heterogeneous set of radio measurements of an optically selected sample led Brown et al. (2011) to the conclusion that all ETGs with an absolute magnitude MK < −25.5 have radio flux densities greater than zero. The analysis of the Low-Frequency ARray (LOFAR) DR1 images of galaxies included in the main galaxy spectroscopic sample of the Sloan Digital Survey (SDSS) led Sabater et al. (2019) to the conclusion that all galaxies with a mass M > 1011 M⊙ display radio-AGN activity with a power > 1021 W Hz−1, that is, they are always switched on. A similar result was found by Grossová et al. (2022) from their study of 42 nearby and X-ray-bright, early-type galaxies, all of them being detected at radio frequencies.
In order to explore the radio emission in the most massive ETGs as seen by the LOFAR surveys in greater detail, we selected a complete volume-limited sample (recession velocity v < 7500 km s−1) of bright galaxies based on infrared surveys, which were less subjected to internal and Galactic absorption. The resulting sample is sufficiently large to obtain robust statistical results, and, thanks to the depth of the LOFAR data, it is possible to reach unprecedented low levels of radio luminosity. With respect to previous studies, we also investigated the radio morphology, an important clue for the nature of RGs, which, thanks to the proximity of these sources can be studied in detail (the scale of the most distant sources is ∼1 kpc per arcsecond). In addition, we probed the radio spectra by comparing the data at 150 MHz with those of the publicly available surveys at 1.4 GHz.
The paper is organized as follows. In Sect. 2, we describe the sample of the selected sources and the available radio observations with LOFAR and from surveys at 1.4 GHz. In Sect. 3, we present the main results, including a description of the radio morphology and spectral shape of the sources of the sample. The information available from optical spectroscopy is described in Sect. 4. In Sect. 5, we discuss the results, which we then summarize in Sect. 6 and draw our conclusions.
2. Sample selection and the LOFAR observations
The LOFAR Two-metre Sky Survey (LoTSS, Shimwell et al. 2017) will cover the whole northern sky with 3168 pointings of at least eight hours of dwell time each in the frequency range between 120 and 168 MHz. The LoTSS first data release (DR1; Shimwell et al. 2019) presented the results obtained from observations of 424 square degrees in the HETDEX Spring Field. The final release images were obtained by combining the images from individual pointings of the survey, producing mosaics covering the region of interest at a 6″ resolution and with a median noise of 71 μJy beam−1. The flux density scale was adjusted to ensure consistency with previous surveys (see Hardcastle et al. 2016 for further details). The second LoTSS data release (DR2) will consist of two contiguous fields at high Galactic latitude centered around 0 h and 13 h and covering approximatively 5700 square degrees (Shimwell et al., in prep.). The DR2 provides fully calibrated mosaics at a resolution of ∼6″, catalogs, and pipeline products. With respect to the DR1, the DR2 products were obtained with an upgraded pipeline (Tasse et al. 2021). LOFAR images can also be obtained from individual LoTSS pointings, outside the DR2 area.
We selected the galaxies included in the 2MASS Redshift Survey (Huchra et al. 2012) requiring a declination Dec > 0°, a Hubble type T ≤ −1, a total absolute magnitude MK ≤ −25, and a recession velocity (corrected for the effects of the Virgo Cluster, the Great Attractor, and the Shapley Supercluster, Mould et al. 2000) v ≤ 7500 km s−1, corresponding to a distance of ≲100 Mpc. As of 31 May 2021, LOFAR observations are available for 188 out of 489 selected galaxies, 111 covered by the DR2 and 77 obtained from individual LoTSS survey pointings (we refer to these as “S” images).
We estimated the rms of each image in various regions, usually centered 45′ away from the source of interest. For the galaxies falling into the DR2 the median rms is 90 μJy beam−1, while this is 200 μJy beam−1 for the “S” images. The higher noise of the “S” images is due to the fact that they are single pointings and they do not benefit from the combination of adjacent pointings in the mosaicking process.
The flux density of the sources included in the DR2 is available from the internally released catalog, while for the sources included in the “S” group we measured their flux density from the LOFAR images after correction for the preliminary scaling factor. The flux density errors are dominated by the uncertainties in the absolute calibration and are typically ∼10%. Several galaxies in the DR2 area have large scale and complex radio structures, not always fully included in the catalog measurement. For these objects, we measured the flux densities on the sky area including the whole source emission within the 3σ contour. We obtained a detection at > 5σ significance for 146 (78%) of the sources of the sample.
The measurements at 1.4 GHz were obtained from the Faint Images of the Radio Sky at Twenty centimeters survey (FIRST, Becker et al. 1995; Helfand et al. 2015) and the National Radio Astronomy Observatory Very Large Array Sky Survey (NVSS, Condon et al. 1998). Eighty-six galaxies are included in the FIRST area and 40 of them are detected by this survey having adopted a search radius of 3″. For the undetected sources, we estimated upper limits at five times the local noise, typically ∼0.14 mJy beam−1. For the 102 galaxies outside the FIRST area, we collected the NVSS measurements with a search radius of 5″; 37 of these sources have an NVSS detection, while for the remaining 65 we generally adopted a limit of 2 mJy. For the extended galaxies, we measured the FIRST flux densities on the same region used for the LOFAR images. In some cases, the LOFAR radio structures have large angular sizes (exceeding ∼1′) and their counterparts at higher frequencies might be resolved out in the FIRST images, due to the poor coverage of the shortest baselines. For these objects, we obtained their flux densities integrating the NVSS images. We followed the same method to estimate the flux density upper limits in the few cases of extended sources not detected by the NVSS.
The list of giant early-type galaxies (gETGs) covered by LOFAR images is presented in Table A.1, where we list their main properties; that is, name, coordinates, recession velocity, absolute K-band magnitude, a code that indicates the origin of the image (“DR2” = within the DR2 area, “S” = individual survey’s pointing), the local rms of the LOFAR image, the flux density at 150 MHz, and the size of the central component of the 150 MHz source. For the extended sources, we also give the largest angular size at the 3σ level and a morphological description, the luminosity at 150 MHz, the 1.4 GHz flux density (from either FIRST or NVSS), and the spectral index between these frequencies1.
3. Results
The distributions in redshift and absolute K-band magnitude (see Fig. 1) show the expected peaks close to the thresholds of the sample selection. The median recession velocity is 6200 km s−1, and the host galaxies have a median magnitude of MK = −25.3 and cover a range of a factor of ∼5 in near-infrared luminosity. Using the relation between the dynamical mass and K-band absolute magnitude, log M* = 10.58−0.44 × (MKs + 23) (derived by Cappellari 2013 from a sample of ETGs with −21.5 < MK < −26), and the corresponding stellar masses of our sample are in the 2.9 × 10¹¹ − 1.5 × 10¹² M⊙ range (median ∼4 × 10¹¹ M⊙).
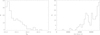 |
Fig. 1. Distributions of absolute K-band magnitude (left) and recession velocity (right) of the 188 sources of the sample. |
The distribution of luminosity at 150 MHz for the sources of the sample (Fig. 2) shows a large spread in power, from ≲1021 W Hz−1 to ∼1026 W Hz−1. Forty-two sources of the sample are not detected by the LOFAR observations at a 5σ flux density limit ranging from 0.4 to 7.4 mJy, with a median value of 1.0 mJy. The corresponding limits to the radio luminosity range from 1.6 × 10²⁰ to 4.8 × 10²¹ W Hz−1, with a median value of 1.1 × 10²¹ W Hz−1.
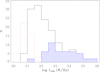 |
Fig. 2. Distribution of 150 MHz luminosity of the gETGs sample. The blue histogram represents the contribution of the 46 extended sources, the dominant population at high luminosities, while the red dotted histogram corresponds to the upper limits of the undetected sources. |
3.1. Radio morphologies of gETGs
We defined the 46 sources in which the 3σ radio contour extends to a radius of at least 15″, about twice the beam FWHM, as extended objects. The extended sources cover a large range of luminosities (1021 ≲ L150 ≲ 1026 W Hz−1) and represent the majority (82%) of the objects with L150 > 1023 W Hz−1 (see Fig. 2).
Three examples of their radio images are presented in Fig. 3 and all are collected in Fig. B.1. The sizes of their radio structures (measured as the largest distance at which the radio emission is detected above the 3σ limit) range from ∼4 to ∼340 kpc. A clear positive trend between radio power and size is present (see Fig. 4), with a behavior consistent with that found for other samples of radio-galaxies (such as the B2 and 3C, e.g., de Ruiter et al. 1990 and more recent samples, e.g., Hardcastle et al. 2019). Most of these extended radio sources (34, ∼76%) have a morphology clearly indicating the presence of jets, usually with an edge-darkened morphology typical of Fanaroff & Riley (1974) FR I class (well defined in 30 cases), with only one example of an FR II (NGC 2892). A few more sources are barely resolved but suggest the presence of a jet structure. Several gETGs show a complex morphology, in at least two cases (namely, NGC 3842 and UGC 12482) presenting a central edge brightened structure and large diffuse tails, suggestive of restarted activity. In two objects (NGC 0687 and NGC 2672) the radio emission, extending over ∼40″ (∼15 kpc) and ∼105″ (∼30 kpc), respectively, is diffuse and lacks of any well defined radio core. For three gETGs (namely IC 5180, UGC 10097, and NGC 2789) the inspection of the low-resolution (∼25″ × 25″, rms ∼ 250 μJy beam−1) LOFAR images (see Fig. 5) reveals the presence of low-brightness lobes not (or barely) visible in the full resolution images. The radio morphology of the gETGs is indicated in Table A.1. In Appendix B, we also give a brief description of the most interesting or complex cases.
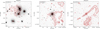 |
Fig. 3. Three examples of LOFAR images at 150 MHz with extended emission superposed to the optical images from Pan-STARRS. Images of all extended sources are shown in the Appendix B. The lowest contour is drawn at three times the local rms, as reported in Table A.1. The following contours increase with a common ratio of 2. |
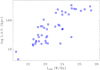 |
Fig. 4. Radio power at 150 MHz versus the largest angular size of the 46 extended sources. A positive trend between radio power and size is present, with behavior consistent with that found for other samples of radio galaxies. |
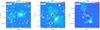 |
Fig. 5. Low-resolution images of the three extended sources showing large-scale low-brightness structures, not (or barely) visible in the full-resolution images. From left to right: NGC 2789, UGC 10097, and IC 5180. |
For all detected sources in the DR2 area we retrieved from the internally released catalog the estimate of their major axis length Rmaj, obtained using Gaussian fitting as described in Shimwell et al. (2019), while for those observed in single pointings we measured this parameter by fitting a 2D Gaussian to the central portion of the images. These sizes, reported in Table A.1, refer effectively to the central component of the radio source; while it can be considered as a robust size estimate for the compact sources, it should be treated with caution for the more extended ones.
In Fig. 6, we show the distribution of Rmaj against their flux density. There is a good correspondence between the sources classified as extended based on the manual size measure and those showing Rmaj > 15″ in the catalog based on the automatic fitting. There are, however, some exceptions; in particular, there are nine objects not included in the list of the extended sources but with a manually measured size ≳15″. We mark them with red circles in Fig. 6 and as P* in Table A.1. Inspection of their images (see Figs. 7 and B.2) shows that at least two of them (namely NGC 1508 and NGC 2493) are possibly jetted sources, while at least another two (namely NGC 0750 and NGC 7722) are diffuse sources, similar to NGC 0687 but of even lower surface brightness.
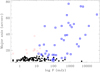 |
Fig. 6. Major axis length of the central component, obtained through Gaussian fitting, versus flux density. The extended sources are marked as empty blue squares, the black dots are those with a full width at half maximum (FWHM) < 15″. The empty red circles are the low-brightness objects, that is, ones whose 3σ level contours do not reach a radius of 15″ but whose FWHM exceeds 15″. |
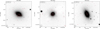 |
Fig. 7. Three examples of LOFAR images at 150 MHz of galaxies not classified as extended sources (that is, whose 3σ level contours do not reach a radius of 15″ but whose FWHM, measured by fitting a 2D Gaussian to the central portion of the images, exceeds 15″. The radio contours are superposed to the optical images from Pan-STARRS. |
However, most of the radio sources associated with the gETGs are compact. Out of the 146 detected objects, more than 60% of the sources has a major axis ≲10″, corresponding to a size of ≲4 kpc.
3.2. Spectral properties of gETGs
In Fig. 8, we compare the LOFAR luminosity with the spectral index between 150 MHz and 1.4 GHz. As already mentioned, the measurements at 1.4 GHz were obtained when available, and reliable, from the FIRST otherwise from the NVSS. All sources detected at 1.4 GHz are also detected in the LOFAR images.
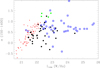 |
Fig. 8. Radio spectral index between 150 MHz and 1.4 GHz defined as Fν ∝ ν−α versus source luminosity at 150 MHz. The green circles are the lower limits derived for the five extended sources not detected at 1.4 GHz. The remaining extended sources in the LOFAR images are marked with blue squares, while the black dots are the unresolved ones. The smaller red dots represent lower limits due to the lack of a detection at 1.4 GHz. |
The point-like objects show a large spread in their spectral slopes,  , but the range could be even larger considering the large fraction of lower limits. Only one compact source detected at both frequencies, NGC 4555, has a spectral index of > 1 (
 ).
).
Most extended sources have  in the 0.5−1 range, which is typical of sources with active jets, but there are a few notable exceptions. Seven of them show a very steep spectral slope (
 , namely NGC 0080, NGC 0507, NGC 0687, NGC 0910, NGC 2672, NGC 2832, and NGC 3842), only three of them being detected (NGC 0507, NGC 2672, and NGC 3842) by the surveys at 1.4 GHz. NGC 507 is already reported to be a remnant source by Murgia et al. (2011). All of them are characterized by rather weak cores, surrounded large-scale emission, often showing a diffuse structure. On the opposite extreme, there is NGC 3894 showing an inverted spectrum,
  : this source has two symmetric faint jets and one bright core, which dominates the flux density of the source and drives its integrated spectral shape in this frequency range.
3.3. Radio and near-infrared host luminosity
In Fig. 9, we compare the near infrared and radio luminosity of the gETGs. By splitting the sample into three bins, 0.5 mag wide (that is, separated by a factor of ∼1.6 in luminosity), we find that the median radio luminosity increases by a factor of ∼3 in each subsequent bin of host luminosity with a dependence of  , in good agreement with previous estimates (Best et al. 2005b). Nonetheless, the spread in L150 within each bin is extremely large, reaching six orders of magnitude for the galaxies of intermediate values of LK. The fraction of detected sources also increases with LK: all gETGs with MK < −26.0 (and actually down to MK = −25.8) are detected in the LOFAR images, only five (that is, ∼9%) are undetected in the bin −25.5 < MK < −26.0, while the fraction of undetected sources increases to ∼35% for the least luminous galaxies. Similarly, the fraction of gETGs with extended radio structures decreases with decreasing infrared luminosity from ∼45% to ∼34%, and, finally, to ∼18% for the same three bins as above. The connection between L150 and LK is present also considering the extended and point-like (or undetected) sources separately.
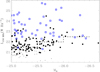 |
Fig. 9. Comparison between absolute K-band magnitude and the luminosity at 150 MHz. The gETGs show a positive link between the stellar luminosity and median radio power but with a very large spread. The blue squares are the extended sources, the black circles the unresolved ones, and the small gray dots are the undetected objects. The dashed histogram represents the median radio luminosity in three bins of absolute magnitude. |
3.4. The fractional radio luminosity function
Figure 10 reports the fraction of gETGs in which we detected a radio source with a power larger than a given threshold. This function is fully determined for log L150 > 21.6 (where f = 55%), the luminosity where we encounter the first upper limit. Below this value, the presence of undetected sources produces two branches, representing the lower and upper envelope of the true distribution. For values log L150 > 21.15, however, they differ by less than 5% (71% and 76%, respectively).
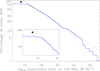 |
Fig. 10. Fraction of galaxies that host a radio source above a given luminosity limit. The blue curve corresponds to the detected sources, the red curve includes the upper limits and represents the upper envelope of the distribution. The black dot represents the result of the stacking of the 42 undetected galaxies. The black dashed line is a power law with a slope of 0.34. The green dashed line is instead the fit obtained by Best et al. (2005b). The inset shows a zoomed-in look at the lowest luminosities. |
This analysis can be extended to even lower radio luminosities by taking advantage of the stacking technique (e.g., White et al. 2007). By performing a median filtering of the images of the 42 undetected sources, we obtain a source with a flux of 0.55 mJy at a 8σ significance. By stacking in the luminosities domain we estimate a median power of 5.1 × 10²⁰ W Hz−1 corresponding to the 89th percentile for the whole sample2. The small offset between the upper envelope of the luminosity distribution from the results of the stacking is rather small (∼5%), indicating that at least half of the undetected sources have luminosities very close to the detection threshold.
The dependence of the radio luminosity on the host mass can be clearly seen by splitting the sample into two bins of magnitude, considering separately the galaxies more luminous than MK < −25.8 (see Fig. 11). The shape of the luminosity functions for the two groups (whose median magnitudes are MK < −25.97 and MK < −25.25, respectively) are quite similar, but with an offset of a factor 20 in radio luminosity or, looking from an orthogonal perspective, the more massive hosts are ∼3 times more likely to have a radio luminosity above a given threshold.
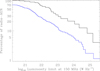 |
Fig. 11. Same as Fig. 10, but splitting the sample into two bins of host luminosity. The black represents the most massive gETGs (K < −25.8), the blue curve corresponds to the less massive gETGs detected with LOFAR, while the red curve includes the upper limits and represents the upper envelope of the distribution for the less massive gETGs. |
4. Optical spectroscopic properties of gETGs
The spectroscopic diagnostic diagrams are commonly used to constrain the gas ionization mechanism (e.g., Heckman 1980; Baldwin et al. 1981; Veilleux & Osterbrock 1987; Kewley et al. 2006) by measuring ratios of selected emission lines. From the main sample of galaxies with spectra available from the SDSS, Data Release 7 (DR7), we used the MPA-JHU DR7 release of spectral measurements3, to obtain fluxes of the diagnostic optical emission lines. SDSS spectra are available for 44 of the gETGs of our sample. However, only in a minority of these spectra it is possible to measure a sufficient number of emission lines, adopting a conservative threshold of a 5σ detection, to locate the gETGs in the diagnostic diagrams (see Fig. 12). In Table 1, we list the key diagnostic line ratios and the Hα luminosity, in units of solar luminosity.
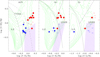 |
Fig. 12. Optical spectroscopic diagnostic diagrams for gETGs with available SDSS spectra adopting a conservative threshold of S/N > 5 for the lines detection. The solid lines are from Kewley et al. (2006) and separate star forming galaxies, LINER, and Seyfert; in the first panel, the region between the two curves is populated by the composite galaxies. The blue circles (red squares) represent gETGs located within the region populated by the composite galaxies (LINERs). A black symbol corresponds to a source of uncertain classification. The green contours represent the iso-densities of all DR7 emission line galaxies. Purple dashed regions mark the location of ionized gas filaments in galaxy clusters as measured by McDonald et al. (2012). |
Optical emission line properties from the SDSS spectra.
Eleven gETGs fall, in the [O III]/Hβ versus [N II]/Hα diagram, into the AGN region, while seven of them are located into the region of “composite galaxies”. None of the gETGs are located in the Seyfert region. For three sources, the limits on the line ratios do not allow us to derive a secure classification. The study presented by Brinchmann et al. (2004) indicates that in 70% of the composite galaxies the AGN contribution accounts for less than 20% of the Hα luminosity, a fraction that rarely exceeds 50%. We consider these seven gETGs as star forming (SF) candidates for which the radio emission may be associated with star-formation. The dominance of star formation to the gas ionization is confirmed based on their [S II]/Hα ratios, while [O I]/Hα ratio can be measured only in one source. These galaxies span the luminosity range −25.0 < MK < −25.8 with a median value of MK = −25.4, similar to the median value of the whole gETGs sample.
Alternative explanations for the origin of ionized gas in massive galaxies, often located at the center of groups or cluster of galaxies, have been proposed and include weak shocks (e.g., Sparks et al. 1989), ionization due to cooling of the hot intra-cluster medium (Voit et al. 1994), thermal conduction (McDonald et al. 2010), and reconnection diffusion (Fabian et al. 2011). The location in the diagnostic diagrams of the ionized gas filaments measured by McDonald et al. (2012) is reported as the dashed purple regions in Fig. 12, and it is generally inconsistent with the line ratios measured in the SF candidates, further supporting our conclusion that the gas ionization in these sources is due to young stars.
The seven SF candidates are all detected by LOFAR. They display different radio morphologies: two (NGC 2918 and NGC 3837) are compact sources, with measured sizes of 8.0″ and 10.6″, respectively (deconvolved sizes ∼3 kpc), three (NGC 3805, NGC 3919, and NGC 5525) are diffuse, low-brightness sources with sizes between 6 and 10 kpc (see Fig. 7), while UGC 07115 is an extended (∼300 kpc) edge-darkened source. The last SF candidate, NGC 2789, is a compact radio source (∼6 kpc) associated with a pair of large-scale (∼800 kpc), low-brightness diffuse lobes, detached from the central component (see Fig. 5). From the point of view of the radio spectra, four SF candidates are detected at 1.4 GHz, with  ranging from 0.22 to 0.88, consistent with the low-frequency radio slope of star forming galaxies (α = 0.59, Klein et al. 2018), while the lower limits for those undetected at 1.4 GHz are in the 0.03−0.51 range.
By adopting the relation from Gürkan et al. (2018), the radio luminosities at 150 MHz of the star forming candidates can be translated into a star formation rate (SFR). By excluding UGC 07115, whose radio emission is dominated by a large-scale structure powered by jets, we obtain a range between 0.1 and 0.5 M⊙ yr−1, with the exception of NGC 2789, for which this estimate is ∼8 M⊙ yr−1. These values compare favorably with those derived by Brinchmann et al. (2004) based on the analysis of their SDSS spectra, with an SFR in the 0.05−4 M⊙ yr−1 range.
The origin of the radio emission of the gETGs with a LINER spectrum (or unclassified) on the left side of Fig. 13 is uncertain, because they can be at least in part powered by a low-luminosity AGN. Consequently, we can only derive upper limits to their star formation rates, ≲0.2−1.2 M⊙ yr−1. For the gETGs not detected by LOFAR, the SFR limits are in the ≲0.1−0.3 M⊙ yr−1 range.
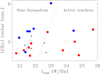 |
Fig. 13. Comparison of radio and Hα luminosities for the gETGs with available SDSS spectra. The diagonal line marks the empirical separation derived by Best & Heckman (2012) between sources in which the radio emission is dominated by star forming regions (to the left) from those in which it is powered by an AGN (to the right). The blue circles correspond to the sources located in the region of star forming galaxies in Fig. 12, the red squares are those located in the LINERs region, the gray ones are those for which no optical spectral classification is possible, the gray downward pointing triangles are upper limits. |
These results suggest that star formation might be the dominant mechanism for the radio emission in a significant fraction (6 out 44; that is, ∼14%) of gETGs. This conclusion is also supported by the diffuse radio morphology observed in three of them.
A different approach to separate radio sources powered by star formation and by an AGN is based on the ratio between Hα and radio luminosity, see Fig. 13. The dividing line is based on the empirical relation derived by Best & Heckman (2012), representing a rather conservative boundary to recognize radio AGNs. We scaled this relation to 150 MHz luminosities by adopting the mean slope of the low-frequency spectrum of star forming galaxies (α = 0.59, Klein et al. 2018). Nine gETGs, not detected by LOFAR and in the Hα line, cannot be located in this diagram. UGC 07115, the SF candidate with the large-scale radio structure, is located to the right of the boundary between SF- and AGN-powered sources (by considering only its core emission, log L150 = 22.85, this galaxy falls on the boundary between SF and AGN). The remaining six SF candidates are in the region populated by star forming galaxies, providing further support to the conclusion that their line emission is associated with the presence of young stars. It must also be noted that the measurements of the Hα luminosity refer only to the region covered by the SDSS fiber (3″ of diameter, ∼1.5 kpc) and are likely to underestimate the total line luminosity of the galaxy.
The presence of sources with a LINER spectrum falling into the region of star forming galaxies in this diagram is, at first sight, puzzling. However, Capetti & Baldi (2011) and Cid Fernandes et al. (2011) have shown that, following earlier analysis (e.g., Trinchieri & di Serego Alighieri 1991; Binette et al. 1994), the LINERs region in the diagnostic diagram is actually mainly populated by objects in which the ionizing radiation is produced by old stars, such as post-asymptotic giant branch stars and white dwarves. Capetti & Baldi (2011) noted that in massive quiescent ETGs, the [O III] line EW is strongly clustered around 0.75 Å, while genuine AGNs are associated with larger EW values. The six gETGs located on the left side of the dividing line in Fig. 13 have EW values between 0.5 and 1.0 Å. They are consistent with their being sources in which the ionizing field is dominated by their old stellar population rather than by young stars.
We conclude that at very low levels of luminosity, the comparison between radio and line emission does not provide a robust tool to understand the origin of radio emission due to the possible contribution to the line emission from different processes, which is not related to star formation and active nuclei.
5. Discussion
5.1. The radio morphology of gETGs
The morphology of radio sources powered by an AGN is determined by the interplay of its age, environment, and jet properties. The analysis presented provides us with an unbiased census of the radio morphology of the most massive early-type galaxies in the local Universe, exploring a complete sample selected only on the basis of their stellar luminosity and regardless of the radio properties.
The size distribution of the radio sources associated with the gETGs shows that 91 (62% of the detected sources) are compact (with a size limit of ∼4 kpc), nine are “diffuse”, and 46 are extended; within the latter class, 17 (12%) have an L.A.S. between 10 and 30 kpc, eight (5%) extend to 60 kpc, 4 (3%) to 100 kpc, and finally 15 (10%) gETGs have a size exceeding 100 kpc. In Baldi et al. (2019), we found that in the Best & Heckman (2012) sample of radio AGNs selected at 1.4 GHz, 63% are the compact FR 0s, 23% have an L.A.S. between 10 and 30 kpc, 13% have 30 < L.A.S. < 60 kpc, and only one source reaches 70 kpc. The lack of very extended sources among those considered by Baldi et al. (2019) is due to the combination of the higher depth of the LOFAR images with respect to the FIRST ones (particularly important for the extended steep spectrum structures) and to the fact that structures larger than ∼1′ might be resolved out due to the lack of short baselines in the uv coverage of the FIRST data (Helfand et al. 2015).
The main result is that the majority of the radio sources associated with gETGs have a size smaller than ∼4 kpc. As already discussed by Baldi et al. (2018, 2019), the large fraction of compact radio sources rules out the possibility that these are all young sources that will evolve into more extended radio galaxies. In fact, by assuming a constant expansion speed, the relative space densities of radio sources are expected to be proportional to the range of sizes covered by each class, contrarily to our findings of a large fraction of compact sources. This argument relies on the assumption that the source luminosity does not undergo a temporal evolution. It is well known that the luminosity of powerful RGs decreases with time (e.g., Maciel & Alexander 2014). However, for the low-power RGs the evolution is likely to produce an increase in their radio luminosity due to the development of an extended structure. Thus, the size distribution of the radio sources in gETGs cannot be ascribed solely to an effect of age, but, most likely, compact and extended radio sources differ in their jet properties. Baldi et al. (2019) suggested that the compact sources are characterized by a lower jet Lorentz factor, an interpretation supported by proper motion studies (Cheng et al. 2021), related to a lower spin of the central black hole.
We now discuss how these sources compare with the compact FR 0s radio galaxies selected by Baldi et al. (2018) and forming the FR0CAT sample. FR0CAT objects were selected from the sample of radio AGNs (Best & Heckman 2012) imposing a redshift z < 0.05, a flux density > 5 mJy, a limit to their sizes of 5 kpc, and requiring an optical spectral classification as low-excitation galaxies (LEGs). The size and optical spectral requirements (at least for those with available spectra) are met by the point-like gETGs. From the point of view of the radio spectral shape, the compact radio sources in gETGs show a range of slopes similar to that observed in FR0CAT (Capetti et al. 2020).
The contribution of compact sources to the overall population of radio galaxies is similar in the two studies (60% and 63%, respectively); by removing the contamination of sources powered by star forming regions, the fraction of compact gETGs is reduced to ∼48%. The resulting slightly lower contribution of compact fraction in gETGs is probably accounted for, noting that (1) as shown above, compact sources are more common in less luminous hosts, and (2) the host luminosity of the FR0CAT sources is lower than those of the gETG, with only half of them having MK < −25.
The luminosity of the compact radio sources associated with the gETGs is generally lower than the range covered by FR 0s (∼1022 − 1024 W Hz−1). This is due to the combination of two effects: the smaller median distance of the gETGs and the lower flux threshold reached by the LOFAR images. Considering the increasing fraction of compact radio sources for lower stellar luminosities, we expect that they represent an even more dominant population in less massive hosts. These results indicate that the FR 0s population selected from the FIRST images is just the tip of the iceberg of a much larger population of compact radio galaxies.
Considering the extended sources, at least 80% of them have a jetted, and usually FR I-class, morphology. This is expected based on their radio luminosities, which are below separation between the two FR classes, ∼2 × 1026 W Hz−1 (Fanaroff & Riley 1974). Only a minority show a complex radio structure in several cases suggestive of restarted activity.
5.2. Restarted and remnant sources
The analysis of a complete sample of giant early-type galaxies, selected only on the basis of their stellar luminosity, can be used to explore the duty cycle of their nuclear activity. In particular, by combining spectral and morphological information it is possible to look for remnant and restarted radio sources (RRSs).
From the point of view of the radio morphology, among the 46 extended sources, there are eight galaxies (NGC 2789, NGC 3665, NGC 3842, UGC 10097, IC 5180, NGC7436B, UGC 12482, and MCG+05-10-007; see Brienza et al. 2021 for a detailed study of this source) in which a bright, small-scale structure is accompanied by large-scale diffuse emission. These gETGs can be considered as possible restarted sources with the structures observed on different scales (and of different surface brightnesses) being produced by subsequent phases of activity. In addition, as discussed in Sect. 3.2, there are seven extended sources with an overall radio spectral index of  , often showing a diffuse radio emission and (with the exception of NGC 3842 as discussed) lacking a prominent central component. These are likely galaxies in which the jets have switched of,f and the integrated spectrum of the lobes is therefore undergoing strong radiative losses (Pacholczyk 1970). By combining these two groups, the overall fraction of candidate RRSs reaches ∼7% of all gETGs and ∼28% of those with extended emission.
Remnant and restarted sources has been the subject of several studies, spurred in particular by the advent of the deep low frequency images provided by LOFAR. Brienza et al. (2017) and Jurlin et al. (2020, 2021) study the properties of 158 extended radio sources in the Lockman Hole and by combining several indicators (e.g., core prominence, low-surface brightness of the extended emission, and steep spectrum of the central region) find a fraction between 13% and 15% of candidate restarted radio galaxies and 7% of remnant radio galaxies. Quici et al. (2021) explored 104 radio sources in the GAMA 23 field with data covering the frequency range 0.1−9 GHz; by adopting a morphological criterion based on the absence of a radio core, they found ten candidate remnant sources, three of them also have a steep spectrum and a diffuse radio morphology. Mahatma et al. (2018) used the core-detection method and found 9% of remnants in the Herschel-ATLAS field. Morganti et al. (2021) combined the images at 1.4 GHz produced by Apertif with those from LOFAR in an area within the Lockman Hole. Based on the spectral index maps, they found 7% (3/46) of restarted sources and 9% (4/46) remnants. The precise number of RRSs clearly depends on the defining criterion and on the sample selection; but, overall, all these works point to an RRS fraction of ∼10−20%.
The fraction of remnant and restarted sources among the gETGs with extended radio structure appears to be larger, ∼30%, although this is somewhat uncertain due to the small number statistics. The presence, at the low radio luminosity probed in these very nearby sources of radio emission powered by star formation does not affect this fraction, because none of the SF candidates is included in the RRSs list. A more likely possibility is that gETGs are often found in very dense environments. The high density of the external medium slows the adiabatic expansion of the radio source, increasing the time over which the remnant emission can be detected (Murgia et al. 2011).
Considering instead the gETGs associated with compact radio sources, we clearly lack any morphological information, and the data on their radio spectral index is generally very limited. Only one of those detected at both frequencies, NGC 4555, has a steep spectrum ( ), suggesting that the observed compact emission might be originated by compact jets which have switched off and are now in the process of fading away. For many of them, we are only able to set a lower limit to their spectral slope but these limits never require a steep spectrum. Based on these data, we are unable to draw any conclusion on their duty cycles, which must await deeper high-frequency radio observations. We note, however, that no source among the 66 compact sources in the FR0CAT sample with available LOFAR observations has a spectral index larger than 1 (Capetti et al. 2020). This suggests that remnants among the compact sources are rare, possibly due to a shorter duration of this phase of their life cycle.
5.3. The fractional radio luminosity function of gETGs
The fractional radio luminosity function of gETGs is well described by a power-law with an index of 0.34 ± 0.02 in the 3 × 10²¹ < L150 < 3 × 1024 W Hz−1 range, and it then steepens at higher luminosities. This behavior is consistent with the results of Best et al. (2005b) (they found an index of 0.35 ± 0.03) up to a luminosity of ∼2 × 10²³ W Hz−1, while for higher power we found a substantial excess of sources. Albeit within the limited statistical significance of our curve at the highest luminosities (only 10 sources have L150 > 3 × 1024 W Hz−1), it appears that the transition to a steeper slope occurs at a power higher by a factor of ∼10 than that derived by Best et al. (2005b) This is expected considering the link between host mass and radio power combined with our selection of the more luminous ETGs; that is, our sample is biased in favor of galaxies with a larger radio power.
We also found sources in which the radio emission is likely powered by star formation. Leaving aside the UGC 07115, the SF source with an FR I morphology, five of the SF candidates have 1021 < L150 < 1022 W Hz−1, and only one has L150 ∼ 1023 W Hz−1. Taking into account the fraction of gETGs for which SDSS spectra are available (44/188, about one quarter of the whole sample), the contribution of SF to the luminosity function at low power may be substantial.
5.4. Star formation in gETGs
As described in Sect. 4, we found seven gETGs whose optical spectral properties suggest that the main source of gas ionization is due to the presence of young stars. In at least three cases, the diffuse morphology of their radio emission supports this interpretation. The detection of gas ionized by young stars in two gETGs characterized by large scale radio emission (namely, UGC 7115 and NGC 2789) indicates that star formation can co-exist with an active nucleus.
The mass of the six SF candidates (leaving aside the extended FR I radio source) are in the 2.9 × 10¹¹ − 6.6 × 10¹¹ M⊙ range. The corresponding values for the sSFR are 0.2−10 × 10−12 yr−1 with a median value of 0.8 × 10⁻¹² yr−1. The median values of the upper limits to the sSFR for the gETGs located in the star forming region in Fig. 13 and for the nine galaxies not detected by LOFAR are ≲0.6 × 10⁻¹² yr−1 and ≲0.4 × 10⁻¹² yr−1, respectively.
Salvador-Rusiñol et al. (2020) found that star formation is ubiquitous in massive early-type galaxies with a redshift of 0.35−0.6, confirming previous claims from Vazdekis et al. (2016). They selected the above redshift range (corresponding to a look back time of ∼4−6 Gyr) motivated by the need to include the key UV absorption index strengths in the optical spectra. The estimate of the fraction of stars formed in the last 2 Gyr is ∼0.5%, corresponding to a specific star formation rate (sSFR) of ∼2.6 × 10⁻¹² yr−1, only slightly higher than measured in the candidate SF gETGs at low redshift of our sample. This implies that star formation is a common process in elliptical galaxies over a large range of time across their evolution.
5.5. Comparison with previous studies.
Several studies, already cited in the introduction, indicate that massive ETGs are all associated with a radio source (Brown et al. 2011; Sabater et al. 2019; Grossová et al. 2022), suggesting that their active nuclei are always switched on. Our results confirm this observational evidence because the 25 galaxies in the present sample more luminous than MK = −25.8 are all detected in the LOFAR images. However, the additional information derived from their morphology, spectral indices, and optical spectra that we used for our analysis indicate that four of them are remnant sources and at least one is likely powered by star formation, but this fraction could be higher considering the limited coverage of the optical spectral data of our sample. The detection of a radio source does not necessarily imply that the active nucleus is currently active.
A significant difference with respect to the study in Grossová et al. (2022) is related to the radio morphology; these authors found that 67% of their galaxies are associated with extended radio sources, a higher fraction than obtained in our sample (24%). This discrepancy is reduced by considering the different criterion adopted for the definition of extended sources: in our analysis, we considered extended sources to be those in which the 3σ radio contour extends to a radius of at least 15″, ∼6 kpc at the median distance of the sample; (Grossová et al. 2022), thanks to the higher spatial resolution of their radio images, considered all sources with a size exceeding twice the beam size as extended, which is typically ∼2″. To perform an appropriate comparison, we must include in the list of extended sources in the Grossová et al. (2022) sample only those of the “D” (diffuse) and “J/L” (jet/lobe) classes, excluding the compact sources (defined as objects with a size smaller than 5 kpc) for a total of 16/42 (38%) galaxies.
The residual difference in the fraction of extended sources might be related to the selection criteria of the sample, because Grossová et al. (2022) only considered X-ray bright sources. More specifically, they adopted a threshold of the X-ray luminosity within a radius of < 10 kpc (but excluding the nuclear source) measured by Lakhchaura et al. (2018) in the 0.5−7.0 keV band of 1040 erg s−1. Dunn et al. (2010) found a positive trend between the radio and X-ray luminosities; the selection of X-ray-bright galaxies biases the sample toward higher radio power and, consequently, to a higher fraction of extended sources, considering the link between radio luminosity and size discussed in Sect. 3.
6. Summary and conclusions
We explored the radio properties of the most massive early type galaxies (gETGs) in the local Universe by selecting 489 sources with an absolute magnitude of MK ≤ −25 and a recession velocity of v ≤ 7500 km s−1. LOFAR observations at 150 MHz are available for 188 of them and 146 gETGs are detected above a median threshold of ∼1 mJy. They span a very large range in radio power (from ∼1021 to ∼1026 W Hz−1) and sizes (from unresolved objects, i.e., smaller than ∼4 kpc, to ∼340 kpc). We confirm the positive link between the median stellar luminosity of the host and the radio power. A positive connection of LK with the fraction of extended galaxies is also found. The RLF of gETGs is in agreement with previous findings, being described by a power-law over a large range of L150 and with a steepening for the most luminous sources. We also found that the most luminous gETGs (25 galaxies with MK < −25.8) are all detected at 150 MHz, but they are not all currently active: at least four of them are remnant sources, and at least one is likely powered by star formation.
However, the luminosity function only describes a statistical trend; while we found, in line with several previous studies, a very large spread (∼5 orders of magnitude) of radio luminosity at any given galaxy’s mass. The analysis of the morphology of sources associated with the gETGs reveals that a connection between the size of radio source and its luminosity is present, the less luminous objects being usually associated with compact sources, with size limits of only a few kpc. We argued that compact and extended radio sources differ in their jet properties, the compact ones possibly being produced by slower jets. When compact and extended sources are considered separately, the spread in radio power is reduced, but it is still quite large. Other factors, such as accretion rate, environment, and the source age, must play a role.
Most sources (62%) are unresolved with a limit to their extension of ∼4 kpc, confirming previous results showing that compact radio sources represent the dominant population of radio galaxies at low luminosities. The study of gETGs indicates that the class of FR 0 sources, selected at higher flux densities and higher frequencies, represents just the tip of the iceberg of a much larger population of compact sources. The high relative fraction of compact sources cannot be ascribed to their youth, but it is more likely related to different jet properties between extended and compact sources; for example, the latter class being characterized by a lower jet Lorentz factor.
Within the gETGs, there are 46 extended sources, with sizes ranging from ∼4 to ∼340 kpc. At least 3/4 of the extended sources have a morphology clearly indicating that they are powered by jets, and most of them are edge-darkened FR I sources, as expected considering their radio luminosity.
Among the extended sources, we found sources whose radio morphology, a large-scale diffuse emission accompanied to a bright small-scale structure, suggests that they are restarted AGNs. In addition, there are galaxies with a steep radio spectral slope ( ), an indication that these are remnant sources. The fraction of remnant/restarted sources represents ∼30% of those with extended radio emission. This fraction, although somewhat uncertain due to the small number of statistics, is higher than what was found in other studies. However, we stress that the criteria used by the various authors to include an object in the RRS class differ significantly, and we must be cautious in drawing strong conclusions. It is possible that the environment plays a major role by slowing the expansion of the relativistic plasma. In order to explore the nature of the candidate RRSs among the gETGs in more detail, dedicated studies at different radio frequencies are required. In particular, the (general) non-detection at 1.4 GHz prevents us from measuring their spectral index distribution and deriving information concerning their ages and evolution.
The combination of deep, low-frequency radio observations and optical spectra enabled us to isolate a subpopulation of gETGs in which the radio emission is likely powered by star formation. This is suggested by both the optical emission line ratios and by their diffuse radio morphology. The sSFR in these sources is quite low, ∼10−12 yr−1, similarly to the estimates based on studies of optical absorption lines of elliptical galaxies at z ∼ 0.35−0.6. The star formation in ETGs detected at higher redshift is also present in, at least, a subset of the local galaxies at a comparable level. This implies that the gas flowing toward the center of these galaxies in part accretes onto the supermassive black hole, powering the AGN, but it can also stall at larger radii and form new stars. Clearly, such a level of star formation does not have a significant impact on the evolution of the host but it is an indication that AGN feedback does not completely quench star formation.
Spectral indices α are defined as Fν ∝ ν−α.
The median luminosity refers to the subsample of 42 upper limits, that is, to the 21st most luminous source among them, to be compared to the full sample size of 188 objects.
Available at http://www.mpa-garching.mpg.de/SDSS/DR7/
Acknowledgments
M. Brienza acknowledges financial support from the ERC-Stg 674 DRANOEL, no. 714245 and the ERC Starting Grant “MAGCOW”, no. 714196. P.N.B. is grateful for support from the UK STFC, via grant ST/V000594/1. A.D. acknowledges support by the BMBF Verbundforschung under the grant 05A20STA. The Jülich LOFAR Long Term Archive and the German LOFAR network are both coordinated and operated by the Jülich Supercomputing Centre (JSC), and computing resources on the supercomputer JUWELS at JSC were provided by the Gauss Centre for supercomputing e.V. (grant CHTB00) through the John von Neumann Institute for Computing (NIC). B.W. acknowledges a studentship from the UK Science and Technology Facilities Council (STFC). LOFAR, the Low Frequency Array designed and constructed by ASTRON, has facilities in several countries, which are owned by various parties (each with their own funding sources), and are collectively operated by the International LOFAR Telescope (ILT) foundation under a joint scientific policy. The ILT resources have benefited from the following recent major funding sources: CNRS-INSU, Observatoire de Paris and Université d’Orléans, France; BMBF, MIWF-NRW, MPG, Germany; Science Foundation Ireland (SFI), Department of Business, Enterprise and Innovation (DBEI), Ireland; NWO, The Netherlands; the Science and Technology Facilities Council, UK; Ministry of Science and Higher Education, Poland; The Istituto Nazionale di Astrofisica (INAF), Italy. Part of this work was carried out on the Dutch national e-infrastructure with the support of the SURF Cooperative through grant e-infra 160022 and 160152. The LOFAR software and dedicated reduction packages on https://github.com/apmechev/GRID_LRT were deployed on the e-infrastructure by the LOFAR e-infragrop, consisting of J.B.R. (ASTRON and Leiden Observatory), A.P. Mechev (Leiden Observatory) and T. Shimwell (ASTRON) with support from N. Danezi (SURFsara) and C. Schrijvers (SURFsara). The Jülich LOFAR Long Term Archive and the German LOFAR network are both coordinated and operated by the Jülich Supercomputing Centre (JSC), and computing resources on the supercomputer JUWELS at JSC were provided by the Gauss Centre for supercomputing e.V. (grant CHTB00) through the John von Neumann Institute for Computing (NIC). This research made use of the University of Hertfordshire high-performance computing facility and the LOFAR-UK computing facility located at the University of Hertfordshire and supported by STFC (ST/P000096/1), and of the Italian LOFAR IT computing infrastructure supported and operated by INAF, and by the Physics Department of Turin University (under an agreement with Consorzio Interuniversitario per la Fisica Spaziale) at the C3S Supercomputing Centre, Italy. The Pan-STARRS1 Surveys (PS1) and the PS1 public science archive have been made possible through contributions by the Institute for Astronomy, the University of Hawaii, the Pan-STARRS Project Office, the Max-Planck Society and its participating institutes, the Max Planck Institute for Astronomy, Heidelberg and the Max Planck Institute for Extraterrestrial Physics, Garching, The Johns Hopkins University, Durham University, the University of Edinburgh, the Queen’s University Belfast, the Harvard-Smithsonian Center for Astrophysics, the Las Cumbres Observatory Global Telescope Network Incorporated, the National Central University of Taiwan, the Space Telescope Science Institute, the National Aeronautics and Space Administration under Grant No. NNX08AR22G issued through the Planetary Science Division of the NASA Science Mission Directorate, the National Science Foundation Grant No. AST-1238877, the University of Maryland, Eotvos Lorand University (ELTE), the Los Alamos National Laboratory, and the Gordon and Betty Moore Foundation.
References
- Baldi, R. D., Capetti, A., & Massaro, F. 2018, A&A, 609, A1 [NASA ADS] [CrossRef] [EDP Sciences] [Google Scholar]
- Baldi, R. D., Capetti, A., & Giovannini, G. 2019, MNRAS, 482, 2294 [NASA ADS] [CrossRef] [Google Scholar]
- Baldwin, J. A., Phillips, M. M., & Terlevich, R. 1981, PASP, 93, 5 [Google Scholar]
- Becker, R. H., White, R. L., & Helfand, D. J. 1995, ApJ, 450, 559 [Google Scholar]
- Best, P. N., & Heckman, T. M. 2012, MNRAS, 421, 1569 [NASA ADS] [CrossRef] [Google Scholar]
- Best, P. N., Kauffmann, G., Heckman, T. M., et al. 2005a, MNRAS, 362, 25 [Google Scholar]
- Best, P. N., Kauffmann, G., Heckman, T. M., & Ivezić, Ž. 2005b, MNRAS, 362, 9 [Google Scholar]
- Binette, L., Magris, C. G., Stasińska, G., & Bruzual, A. G. 1994, A&A, 292, 13 [NASA ADS] [Google Scholar]
- Brienza, M., Godfrey, L., Morganti, R., et al. 2017, A&A, 606, A98 [NASA ADS] [CrossRef] [EDP Sciences] [Google Scholar]
- Brienza, M., Shimwell, T. W., de Gasperin, F., et al. 2021, Nat. Astron., 5, 1261 [NASA ADS] [CrossRef] [Google Scholar]
- Brinchmann, J., Charlot, S., White, S. D. M., et al. 2004, MNRAS, 351, 1151 [Google Scholar]
- Brown, M. J. I., Jannuzi, B. T., Floyd, D. J. E., & Mould, J. R. 2011, ApJ, 731, L41 [Google Scholar]
- Capetti, A., & Baldi, R. D. 2011, A&A, 529, A126 [NASA ADS] [CrossRef] [EDP Sciences] [Google Scholar]
- Capetti, A., Brienza, M., Baldi, R. D., et al. 2020, A&A, 642, A107 [NASA ADS] [CrossRef] [EDP Sciences] [Google Scholar]
- Cappellari, M. 2013, ApJ, 778, L2 [NASA ADS] [CrossRef] [Google Scholar]
- Cheng, X., An, T., Sohn, B. W., Hong, X., & Wang, A. 2021, MNRAS, 506, 1609 [NASA ADS] [CrossRef] [Google Scholar]
- Cid Fernandes, R., Stasińska, G., Mateus, A., & Vale Asari, N. 2011, MNRAS, 413, 1687 [Google Scholar]
- Colla, G., Fanti, C., Fanti, R., et al. 1975, A&AS, 20, 1 [NASA ADS] [Google Scholar]
- Condon, J. J., Cotton, W. D., Greisen, E. W., et al. 1998, AJ, 115, 1693 [Google Scholar]
- Condon, J. J., Cotton, W. D., & Broderick, J. J. 2002, AJ, 124, 675 [Google Scholar]
- Croton, D. J., Springel, V., White, S. D. M., et al. 2006, MNRAS, 365, 11 [Google Scholar]
- de Ruiter, H. R., Parma, P., Fanti, C., & Fanti, R. 1990, A&A, 227, 351 [NASA ADS] [Google Scholar]
- Dunn, R. J. H., Allen, S. W., Taylor, G. B., et al. 2010, MNRAS, 404, 180 [NASA ADS] [Google Scholar]
- Ekers, R. D., & Ekers, J. A. 1973, A&A, 24, 247 [NASA ADS] [Google Scholar]
- Fabian, A. C. 2012, ARA&A, 50, 455 [Google Scholar]
- Fabian, A. C., Sanders, J. S., Williams, R. J. R., et al. 2011, MNRAS, 417, 172 [NASA ADS] [CrossRef] [Google Scholar]
- Fanaroff, B. L., & Riley, J. M. 1974, MNRAS, 167, 31 [Google Scholar]
- Fanti, R., Gioia, I., Lari, C., & Ulrich, M. H. 1978, A&AS, 34, 341 [NASA ADS] [Google Scholar]
- Grossová, R., Werner, N., Massaro, F., et al. 2022, ApJS, 258, 30 [CrossRef] [Google Scholar]
- Gürkan, G., Hardcastle, M. J., Smith, D. J. B., et al. 2018, MNRAS, 475, 3010 [Google Scholar]
- Hardcastle, M. J., Gürkan, G., van Weeren, R. J., et al. 2016, MNRAS, 462, 1910 [Google Scholar]
- Hardcastle, M. J., Williams, W. L., Best, P. N., et al. 2019, A&A, 622, A12 [NASA ADS] [CrossRef] [EDP Sciences] [Google Scholar]
- Heckman, T. M. 1980, A&A, 87, 152 [Google Scholar]
- Helfand, D. J., White, R. L., & Becker, R. H. 2015, ApJ, 801, 26 [NASA ADS] [CrossRef] [Google Scholar]
- Huchra, J. P., Macri, L. M., Masters, K. L., et al. 2012, ApJS, 199, 26 [Google Scholar]
- Jones, D. H., Saunders, W., Colless, M., et al. 2004, MNRAS, 355, 747 [NASA ADS] [CrossRef] [Google Scholar]
- Jurlin, N., Morganti, R., Brienza, M., et al. 2020, A&A, 638, A34 [EDP Sciences] [Google Scholar]
- Jurlin, N., Brienza, M., Morganti, R., et al. 2021, A&A, 653, A110 [NASA ADS] [CrossRef] [EDP Sciences] [Google Scholar]
- Kewley, L. J., Groves, B., Kauffmann, G., & Heckman, T. 2006, MNRAS, 372, 961 [Google Scholar]
- Klein, U., Lisenfeld, U., & Verley, S. 2018, A&A, 611, A55 [NASA ADS] [CrossRef] [EDP Sciences] [Google Scholar]
- Lakhchaura, K., Werner, N., Sun, M., et al. 2018, MNRAS, 481, 4472 [NASA ADS] [CrossRef] [Google Scholar]
- Ledlow, M. J., & Owen, F. N. 1996, AJ, 112, 9 [Google Scholar]
- Maciel, T., & Alexander, P. 2014, MNRAS, 442, 3469 [CrossRef] [Google Scholar]
- Mahatma, V. H., Hardcastle, M. J., Williams, W. L., et al. 2018, MNRAS, 475, 4557 [Google Scholar]
- Mauch, T., & Sadler, E. M. 2007, MNRAS, 375, 931 [Google Scholar]
- McDonald, M., Veilleux, S., Rupke, D. S. N., & Mushotzky, R. 2010, ApJ, 721, 1262 [Google Scholar]
- McDonald, M., Veilleux, S., & Rupke, D. S. N. 2012, ApJ, 746, 153 [Google Scholar]
- Morganti, R., Oosterloo, T. A., Brienza, M., et al. 2021, A&A, 648, A9 [EDP Sciences] [Google Scholar]
- Mould, J. R., Huchra, J. P., Freedman, W. L., et al. 2000, ApJ, 529, 786 [Google Scholar]
- Murgia, M., Parma, P., Mack, K. H., et al. 2011, A&A, 526, A148 [NASA ADS] [CrossRef] [EDP Sciences] [Google Scholar]
- Neff, S. G., Roberts, L., & Hutchings, J. B. 1995, ApJS, 99, 349 [Google Scholar]
- Pacholczyk, A. G. 1970, Radio Astrophysics. Nonthermal Processes in Galactic and Extragalactic Sources (San Francisco: Freeman) [Google Scholar]
- Quici, B., Hurley-Walker, N., Seymour, N., et al. 2021, PASA, 38, e008 [CrossRef] [Google Scholar]
- Sabater, J., Best, P. N., Hardcastle, M. J., et al. 2019, A&A, 622, A17 [NASA ADS] [CrossRef] [EDP Sciences] [Google Scholar]
- Sadler, E. M., Jenkins, C. R., & Kotanyi, C. G. 1989, MNRAS, 240, 591 [NASA ADS] [Google Scholar]
- Salvador-Rusiñol, N., Vazdekis, A., La Barbera, F., et al. 2020, Nat. Astron., 4, 252 [CrossRef] [Google Scholar]
- Shabala, S. S., Ash, S., Alexander, P., & Riley, J. M. 2008, MNRAS, 388, 625 [NASA ADS] [CrossRef] [Google Scholar]
- Shimwell, T. W., Röttgering, H. J. A., Best, P. N., et al. 2017, A&A, 598, A104 [NASA ADS] [CrossRef] [EDP Sciences] [Google Scholar]
- Shimwell, T. W., Tasse, C., Hardcastle, M. J., et al. 2019, A&A, 622, A1 [NASA ADS] [CrossRef] [EDP Sciences] [Google Scholar]
- Sparks, W. B., Macchetto, F., & Golombek, D. 1989, ApJ, 345, 153 [NASA ADS] [CrossRef] [Google Scholar]
- Tasse, C., Shimwell, T., Hardcastle, M. J., et al. 2021, A&A, 648, A1 [EDP Sciences] [Google Scholar]
- Trinchieri, G., & di Serego Alighieri, S. 1991, AJ, 101, 1647 [NASA ADS] [CrossRef] [Google Scholar]
- Vazdekis, A., Koleva, M., Ricciardelli, E., Röck, B., & Falcón-Barroso, J. 2016, MNRAS, 463, 3409 [Google Scholar]
- Veilleux, S., & Osterbrock, D. E. 1987, ApJS, 63, 295 [Google Scholar]
- Voit, G. M., Donahue, M., & Slavin, J. D. 1994, ApJS, 95, 87 [Google Scholar]
- White, R. L., Helfand, D. J., Becker, R. H., Glikman, E., & de Vries, W. 2007, ApJ, 654, 99 [Google Scholar]
- Wrobel, J. M. 1991, AJ, 101, 127 [NASA ADS] [CrossRef] [Google Scholar]
- Wrobel, J. M., & Heeschen, D. S. 1991, AJ, 101, 148 [Google Scholar]
- York, D. G., Adelman, J., Anderson, J. E., Jr., et al. 2000, AJ, 120, 1579 [NASA ADS] [CrossRef] [Google Scholar]
Appendix A: Properties of the sample
Properties of the sample.
Appendix B: Images and notes on the radio morphology of the extended and diffuse sources
In this appendix, we show the images of all the extended and diffuse sources and a brief description of the most interesting or complex cases.
Here, we present the images and a description of the properties of the individual sources with extended emission and report their classification as in Table A.1. We also briefly describe the nine objects not included in the list of the extended sources (as they do not reach a size of 15″ at the 3σ level) but with a measured size ≳15″ (the “diffuse” sources).
NGC 0071 (complex). The radio emission to the north is associated with a nearby spiral galaxy and, to a lesser extent, with a smaller nearby elliptical. Diffuse, low-brightness emission to the east is also present. This source is not covered by FIRST, and in the NVSS it is confused with the nearby galaxies. No spectral index information can be obtained.
NGC 0080 (complex). The source is elongated in the NS direction on small scales, but the more extended structure is oriented along an EW axis. On the west side, the emission bends sharply toward the south. This source is not detected at 1.4 GHz, resulting in a very steep spectral index ( ).
).
NGC 0687 (diffuse). This radio source is diffuse, and it lacks a central compact source. It is not detected at 1.4 GHz, resulting in a steep spectral index ( ).
).
NGC 0777 (FRI). The source is dominated by a bright compact core, from which emerge two small-scale (18 kpc of total extent) jets.
NGC 0910 (complex). Two elongated features emerge from a compact central source. However, these are rather diffuse and do not appear to be collimated jets. The overall spectral index is very steep ( ).
).
CGCG 286-070 (FRI?). The emission peak is located at the center of the source, suggesting an FR I morphology; yet, the small angular size makes this classification uncertain.
NGC 2672 (Diffuse). Diffuse, ring-like structure with a diameter of ∼30 kpc.
NGC 2783 (Ext. ?). The asymmetry of the source suggests a core-jet morphology, but the small angular size makes any classification uncertain.
NGC 2789 (Ext. ?). The central component of this source is elongated in the NS direction, but the small angular size makes any classification uncertain. However, two low brightness lobes are visible in the low-resolution LOFAR image: the total size of the source exceeds 700 kpc.
NGC 2832 (FRI?). The compact radio source on the SW side is associated with a nearby galaxy. This source is elongated in the NS direction, suggesting an FR I morphology; yet, the small angular size makes this classification uncertain. This source is not detected at 1.4 GHz, resulting in a steep spectral index ( ).
).
NGC 3665 (FRI). This galaxy presents two opposite large-scale jets (55 kpc in total extent), for an overall FR I morphology. However, close to the nucleus (∼3 kpc) two bright knots of higher surface brightness are seen, possibly indicating a restarted source.
NGC 3842 (complex). Two radio tails extend over ∼160 kpc. However, the central regions are dominated by a small-scale, H-shaped structure, ∼15 kpc wide, reminiscent of the morphology seen in 3C 171 (Neff et al. 1995). The steep spectral index ( ) might indicate that this is a restarted source and the tails are remnants of a previous phase of activity.
NGC 3894 (FRI). The source is dominated by a bright compact core, from which emerge two small-scale (16 kpc of total extent) jets. The overall spectral shape is flat ( ), in line with its high core dominance.
M 60 (FRI). Small-scale (∼4 kpc in length) FR I.
NGC 5141 (FRII). The only gETG of the sample associated with a radio source of FR II morphology. In the radio-host luminosity diagram of Ledlow & Owen (1996), this source is located close to the boundary between FR Is and FR IIs.
UGC 10097 (FRI). In addition to the central FR I structure, the low-resolution LOFAR images show two large-scale diffuse lobes, reaching a radius of ∼200″ (∼500 kpc).
NGC 6524 (Ext. ?). The angular size of this source is too small to explore its morphology.
IC 5180 (FRI). In addition to the central FR I structure, the low resolution LOFAR images show two large-scale diffuse lobes.
NGC 7274 (Ext. ?). The angular size of this source is too small to explore its morphology.
UGC 12482 (Complex). The central region shows the presence of a triple source, extending for ∼30 kpc, while long symmetric tails reach a distance of ∼90 kpc, suggesting that this might be a restarted source and that the tails are remnants of a previous phase of activity.
Notes on the sources not classified as extended but with sizes larger than 15″:
NGC 0750 (Diffuse). The radio emission is diffuse and it extends to include a southern companion galaxy.
NGC 1508 (FRI?). This source is elongated in the NE-SW direction, suggesting an FR I morphology; however, the small angular size makes this classification uncertain.
NGC 2493 (FRI?). This source is elongated in the NE-SW direction, suggesting an FR I morphology; however, the small angular size makes this classification uncertain. The spectral index is rather steep ( ).
).
NGC 3805 (Diffuse). The radio emission is diffuse and it extends mostly on the southern side of the host.
NGC 3919 (Ext. ?). The radio emission is slightly elongated in the NS direction, but the small angular size makes this classification uncertain.
NGC 5525 (Ext. ?). The radio emission is slightly elongated in the NS direction, but the small angular size makes this classification uncertain.
NGC 6628 (Ext. ?). Radio source elongated in the EW direction, approximately aligned with the optical axis.
NGC 7681 (Ext. ?). The emission peak is located at the host’s center, with diffuse emission extending toward the west.
NGC 7722 (Diffuse). Diffuse radio emission cospatial with the optical emission.
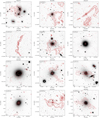 |
Fig. B.1. LOFAR images at 150 MHz of the 46 galaxies showing extended emission. The lowest contour is drawn at three times the local r.m.s., as reported in Table A.1. The radio contours are superposed to the optical images from Pan-STARRS. |
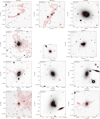 |
Fig. B.1. continued. |
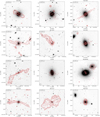 |
Fig. B.1. continued. |
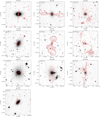 |
Fig. B.1. continued. |
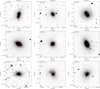 |
Fig. B.2. LOFAR images at 150 MHz of the nine galaxies not classified as extended sources (that is, whose 3σ level contours do not reach a radius of 15″ but whose FWHM, measured by fitting a 2D Gaussian to the central portion of the images, exceeds 15″. |
All Tables
All Figures
|
Fig. 1. Distributions of absolute K-band magnitude (left) and recession velocity (right) of the 188 sources of the sample. |
| In the text | |
|
Fig. 2. Distribution of 150 MHz luminosity of the gETGs sample. The blue histogram represents the contribution of the 46 extended sources, the dominant population at high luminosities, while the red dotted histogram corresponds to the upper limits of the undetected sources. |
| In the text | |
|
Fig. 3. Three examples of LOFAR images at 150 MHz with extended emission superposed to the optical images from Pan-STARRS. Images of all extended sources are shown in the Appendix B. The lowest contour is drawn at three times the local rms, as reported in Table A.1. The following contours increase with a common ratio of 2. |
| In the text | |
|
Fig. 4. Radio power at 150 MHz versus the largest angular size of the 46 extended sources. A positive trend between radio power and size is present, with behavior consistent with that found for other samples of radio galaxies. |
| In the text | |
|
Fig. 5. Low-resolution images of the three extended sources showing large-scale low-brightness structures, not (or barely) visible in the full-resolution images. From left to right: NGC 2789, UGC 10097, and IC 5180. |
| In the text | |
|
Fig. 6. Major axis length of the central component, obtained through Gaussian fitting, versus flux density. The extended sources are marked as empty blue squares, the black dots are those with a full width at half maximum (FWHM) < 15″. The empty red circles are the low-brightness objects, that is, ones whose 3σ level contours do not reach a radius of 15″ but whose FWHM exceeds 15″. |
| In the text | |
|
Fig. 7. Three examples of LOFAR images at 150 MHz of galaxies not classified as extended sources (that is, whose 3σ level contours do not reach a radius of 15″ but whose FWHM, measured by fitting a 2D Gaussian to the central portion of the images, exceeds 15″. The radio contours are superposed to the optical images from Pan-STARRS. |
| In the text | |
|
Fig. 8. Radio spectral index between 150 MHz and 1.4 GHz defined as Fν ∝ ν−α versus source luminosity at 150 MHz. The green circles are the lower limits derived for the five extended sources not detected at 1.4 GHz. The remaining extended sources in the LOFAR images are marked with blue squares, while the black dots are the unresolved ones. The smaller red dots represent lower limits due to the lack of a detection at 1.4 GHz. |
| In the text | |
|
Fig. 9. Comparison between absolute K-band magnitude and the luminosity at 150 MHz. The gETGs show a positive link between the stellar luminosity and median radio power but with a very large spread. The blue squares are the extended sources, the black circles the unresolved ones, and the small gray dots are the undetected objects. The dashed histogram represents the median radio luminosity in three bins of absolute magnitude. |
| In the text | |
|
Fig. 10. Fraction of galaxies that host a radio source above a given luminosity limit. The blue curve corresponds to the detected sources, the red curve includes the upper limits and represents the upper envelope of the distribution. The black dot represents the result of the stacking of the 42 undetected galaxies. The black dashed line is a power law with a slope of 0.34. The green dashed line is instead the fit obtained by Best et al. (2005b). The inset shows a zoomed-in look at the lowest luminosities. |
| In the text | |
|
Fig. 11. Same as Fig. 10, but splitting the sample into two bins of host luminosity. The black represents the most massive gETGs (K < −25.8), the blue curve corresponds to the less massive gETGs detected with LOFAR, while the red curve includes the upper limits and represents the upper envelope of the distribution for the less massive gETGs. |
| In the text | |
|
Fig. 12. Optical spectroscopic diagnostic diagrams for gETGs with available SDSS spectra adopting a conservative threshold of S/N > 5 for the lines detection. The solid lines are from Kewley et al. (2006) and separate star forming galaxies, LINER, and Seyfert; in the first panel, the region between the two curves is populated by the composite galaxies. The blue circles (red squares) represent gETGs located within the region populated by the composite galaxies (LINERs). A black symbol corresponds to a source of uncertain classification. The green contours represent the iso-densities of all DR7 emission line galaxies. Purple dashed regions mark the location of ionized gas filaments in galaxy clusters as measured by McDonald et al. (2012). |
| In the text | |
|
Fig. 13. Comparison of radio and Hα luminosities for the gETGs with available SDSS spectra. The diagonal line marks the empirical separation derived by Best & Heckman (2012) between sources in which the radio emission is dominated by star forming regions (to the left) from those in which it is powered by an AGN (to the right). The blue circles correspond to the sources located in the region of star forming galaxies in Fig. 12, the red squares are those located in the LINERs region, the gray ones are those for which no optical spectral classification is possible, the gray downward pointing triangles are upper limits. |
| In the text | |
|
Fig. B.1. LOFAR images at 150 MHz of the 46 galaxies showing extended emission. The lowest contour is drawn at three times the local r.m.s., as reported in Table A.1. The radio contours are superposed to the optical images from Pan-STARRS. |
| In the text | |
|
Fig. B.1. continued. |
| In the text | |
|
Fig. B.1. continued. |
| In the text | |
|
Fig. B.1. continued. |
| In the text | |
|
Fig. B.2. LOFAR images at 150 MHz of the nine galaxies not classified as extended sources (that is, whose 3σ level contours do not reach a radius of 15″ but whose FWHM, measured by fitting a 2D Gaussian to the central portion of the images, exceeds 15″. |
| In the text | |
Current usage metrics show cumulative count of Article Views (full-text article views including HTML views, PDF and ePub downloads, according to the available data) and Abstracts Views on Vision4Press platform.
Data correspond to usage on the plateform after 2015. The current usage metrics is available 48-96 hours after online publication and is updated daily on week days.
Initial download of the metrics may take a while.