Fig. 8.
Download original image
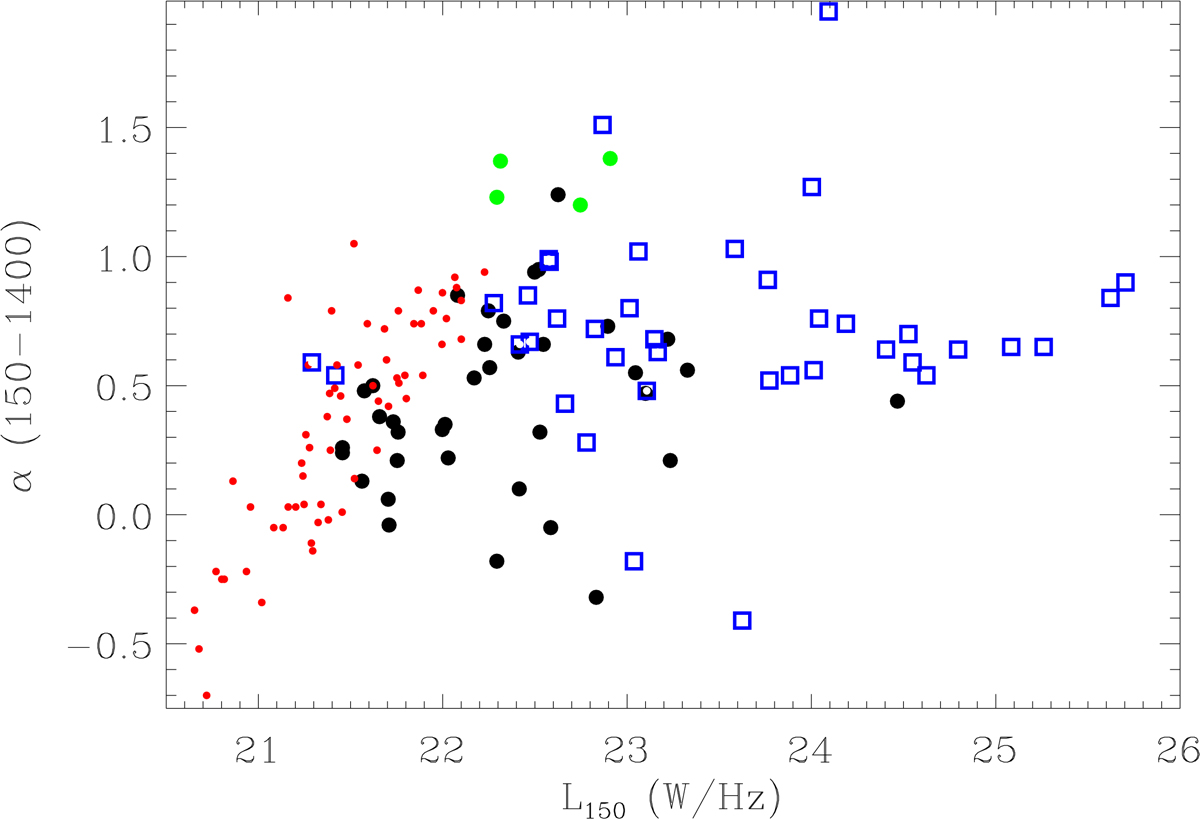
Radio spectral index between 150 MHz and 1.4 GHz defined as Fν ∝ ν−α versus source luminosity at 150 MHz. The green circles are the lower limits derived for the five extended sources not detected at 1.4 GHz. The remaining extended sources in the LOFAR images are marked with blue squares, while the black dots are the unresolved ones. The smaller red dots represent lower limits due to the lack of a detection at 1.4 GHz.
Current usage metrics show cumulative count of Article Views (full-text article views including HTML views, PDF and ePub downloads, according to the available data) and Abstracts Views on Vision4Press platform.
Data correspond to usage on the plateform after 2015. The current usage metrics is available 48-96 hours after online publication and is updated daily on week days.
Initial download of the metrics may take a while.