| Issue |
A&A
Volume 690, October 2024
|
|
|---|---|---|
| Article Number | A195 | |
| Number of page(s) | 17 | |
| Section | Extragalactic astronomy | |
| DOI | https://doi.org/10.1051/0004-6361/202450365 | |
| Published online | 10 October 2024 | |
ViCTORIA project: The LOFAR-MeerKAT view of active galactic nuclei in Virgo cluster early-type galaxies
1
Hamburger Sternwarte, University of Hamburg, Gojenbergsweg 112, D-21029 Hamburg, Germany
2
INAF – Istituto di Radioastronomia, Via P. Gobetti 101, Bologna, Italy
3
Department of Physics and Astronomy, University of Kentucky, 505 Rose Street, Lexington, KY 40506, USA
4
Aix Marseille Univ., CNRS, CNES, LAM, 13388 Marseille Cedex 13, France
5
Leiden Observatory, Leiden University, PO Box 9513 2300 RA Leiden, The Netherlands
6
Università degli Studi di Milano-Bicocca, Piazza della Scienza 3, Milano, Italy
7
INAF – Osservatorio Astronomico di Brera, Via Brera 28, Milano, Italy
Received:
13
April
2024
Accepted:
3
June
2024
Abstract
Context. The evolution of active galactic nuclei (AGNs) is closely connected to their host galaxies and surroundings. Via feedback processes, AGNs can counteract the cooling of the intracluster medium (ICM) and suppress star formation in their host galaxies. Radio observations at low frequencies provide a glimpse into the history of AGN activity. The Virgo cluster is a substantial reservoir of nearby galaxies and provides an ideal laboratory for the study of AGNs as well as their feedback mechanisms.
Aims. The aim of our work is to characterise the AGN population within the Virgo cluster down to low radio luminosities, constrain the AGN duty cycle, and investigate environmental feedback in cluster member galaxies.
Methods. We analysed 144 MHz and 1.3 GHz radio observations of early-type galaxies from the ACS Virgo Cluster Survey (ACSVCS) taken with LOFAR and MeerKAT.
Results. We detect 12 of these galaxies at 144 MHz, five of which show clearly extended radio emission. The radio luminosity shows a strong dependence on the stellar mass of the host galaxy, in agreement with previous results. As a notable outlier, the massive elliptical galaxy NGC 4365 (M* = 2.2 × 10¹¹ M⊙) is not detected as compact source in the LOFAR observations. Instead, it is surrounded by diffuse, low-surface brightness emission, which hints towards a past phase of stronger nuclear activity. Furthermore, we find a cavity in NGC 4472 (=M 49) inflated by the wide-angle tail only visible in the LOFAR data, which implies that the cavity was created by a past outburst. The corresponding cavity power is of the same order of magnitude as the jet power in the present duty cycle of the AGN.
Key words: radiation mechanisms: non-thermal / galaxies: active / galaxies: elliptical and lenticular / cD / galaxies: clusters: individual: Virgo / galaxies: jets
Corresponding author; This email address is being protected from spambots. You need JavaScript enabled to view it.
© The Authors 2024
 Open Access article, published by EDP Sciences, under the terms of the Creative Commons Attribution License (https://creativecommons.org/licenses/by/4.0), which permits unrestricted use, distribution, and reproduction in any medium, provided the original work is properly cited.
This article is published in open access under the Subscribe to Open model. This email address is being protected from spambots. You need JavaScript enabled to view it. to support open access publication.
1. Introduction
Most nearby galaxies harbour a supermassive black hole (SMBH) in their centre. By accreting matter (mostly gas and dust) via an accretion disk forming around the SMBH, the galaxy can manifest an active galactic nucleus (AGN, Hoyle & Fowler 1963). These AGNs can produce emission over a wide range of the electromagnetic spectrum and are complicated objects in terms of their phenomenology. Most characteristically, they can produce two collimated jets of relativistic particles.
A primary way to probe these jets is the observation of their non-thermal synchrotron emission in radio galaxies. As AGNs show a large variety of radio properties and morphologies, the study of radio emission gives important insights into the mechanisms feeding the nuclear activity. Many scaling relations between the radio emission from AGN, their properties, and the host galaxy properties have been identified in the past (e.g. Best et al. 2005; Kormendy & Ho 2013; Capetti et al. 2022).
Analysing a large sample of radio-loud galaxies with z ≤ 0.3, Best et al. (2005) find a strong correlation between the radio-loud AGN fraction and the host mass. This correlation has been confirmed in later studies, as in Sabater et al. (2019) using LOFAR data, concluding that all galaxies with M > 1011 M⊙ host a radio-loud AGN. Similar results were found by Grossová et al. (2022) in a sample of nearby X-ray-bright galaxies, and by Capetti et al. (2022) in their study of giant early-type galaxies in the nearby Universe. They also find a connection between the size of the radio source and its luminosity, arguing that the jet properties of point sources differ from those of extended sources.
The morphology, extent, and spectral properties of the extended radio emission allow us to probe the evolution of jet activity. Since relativistic particles emitting at the highest radio frequencies lose energy faster than those emitting at lower frequencies, the spectrum of synchrotron emission steepens with time (Kardashev 1962; Jaffe & Perola 1973; Harwood et al. 2013). This spectral steepening causes AGN plasma to be only observable only for a relatively short time at Gigahertz frequencies and above. Low-frequency observations (< 300 MHz), such as those conducted by the LOw-Frequency ARray (LOFAR, van Haarlem et al. 2013), are therefore especially important to trace the oldest outbursts and past evolution of AGNs.
In order to study AGN-related radio emission, it is important to differentiate from the radio emission produced by star formation. As this can become very complicated for star-forming galaxies, a lot of studies focus on AGNs in early-type galaxies, in which the contribution to radio emission from star formation is much smaller (e.g. Best et al. 2005; Capetti et al. 2009, 2022; Sabater et al. 2019). This is also the case in our study.
Jets of radio galaxies can transfer energy and momentum into the surrounding medium, causing a heating of the gas. This re-deposition of energy is known as AGN feedback (Fabian 2012). The process is not only able to quench star formation but also prevents the growth of galaxies via gas accretion (Kormendy & Ho 2013).
Active galactic nuclei are therefore believed to play an important role in the evolution of their host galaxies (Ferrarese & Merritt 2000; Vanden Berk et al. 2006). This can be seen best in the tight correlation of the black hole mass with the masses of elliptical galaxies and bulges (Kormendy & Ho 2013). On larger scales, AGNs also play a role in the evolution of the clusters they reside in (e.g. McNamara & Nulsen 2012) and are affected by it Hu et al. (2023). Multiple studies show that radio galaxies are more common in galaxy-rich environments Bîrzan et al. (2004), Sabater et al. (2013), Malavasi et al. (2015). There are, however, still many open questions in this field.
Especially in galaxy clusters, AGN feedback has a large effect on the intracluster medium (ICM). In so-called radio-mode feedback, the jets expel radio-heated gas into the ICM, which pushes the X-ray heated gas away (Shabala et al. 2020), forming large radio lobes. This creates ‘cavities’ in the ICM, areas where a lack of X-ray emission can be seen. With these cavities it is possible to estimate the power of the jet that produced them and the energy that is supplied to the surrounding medium (Bîrzan et al. 2004, 2008; Rafferty et al. 2006).
As the nearest massive (Mvir = 1.0 − 1.4 × 10¹⁴ M⊙, Urban et al. 2011; Ferrarese et al. 2012; Simionescu et al. 2017) galaxy cluster, the Virgo cluster is not only the largest accumulation of early-type galaxies in the local universe, but also a prime target to study AGN feedback. Studies of the system allow us to probe AGN across a vast range of luminosities and host galaxy masses. A study of the early-type galaxies in the Virgo cluster has been done by Capetti et al. (2009) using the Very Large Array (VLA) at a frequency of 8.4 GHz, in which they investigated the origin of radio emission and the connection with the properties of the host galaxies. Analysing a sample of the 63 optically brightest ACSVCS galaxies, of which 12 showed the presence of a compact radio source, they found a strong relation between the AGN fraction and stellar mass, in agreement with other results. They also found that some massive galaxies showed no signs of nuclear activity despite the high mass of the SMBH.
In this paper, we extend the analysis of the early-type galaxies in Virgo done by Capetti et al. (2009) to lower frequencies, using the high-sensitivity LOFAR and MeerKAT data of the ‘Virgo cluster multi-telescope observations in radio of interacting galaxies and AGN’ (ViCTORIA) project (Edler et al. 2023, de Gasperin et al., in prep.). This allows us to study the presence of extended jets and past phases of nuclear activity.
The structure of the paper is as follows. In Section 2, we describe the sample selection and give an overview of the radio data. Section 3 discusses the radio analysis of the full data sample and analysis of the relations between the different properties. In Section 4, we focus on the properties of the extended sources. A summary and conclusion is given in Section 5. Throughout this paper we adopt a flat ΛCDM cosmology with H0 = 70 km s−1 Mpc−1, ΩM = 0.3, and ΩΛ = 0.7. At the distance of NGC 4486 (=M 87) d = 16.5 Mpc (Mei et al. 2007; Cantiello et al. 2018), one arcsecond corresponds to 80 pc.
2. Data and sample
In our study, we have analysed multi-frequency radio data of a sample of early-type galaxies in the Virgo cluster. The radio data were collected in the context of the ongoing ‘Virgo Cluster multi-Telescope Observations in Radio of Interacting Galaxies and AGN’ (ViCTORIA) project (de Gasperin et al., in prep.). The final ViCTORIA dataset will consist of three blind radio surveys of the cluster, using the LOFAR low-band antenna (LBA, 42–66 MHz), the LOFAR high-band antenna (HBA, 120–168 MHz), and MeerKAT (856–1712 MHz). For this study, we employed the LOFAR HBA data, which was published previously in Edler et al. (2023) and is available in the public domain1. In addition, we carried out the data reduction and analysis of the MeerKAT observations covering the sources in our sample. In the following section, we introduce this sample and the data reduction procedure of the radio observations.
2.1. Sample selection
Our sample is composed of the galaxies from the ACS Virgo Cluster Survey (ACSVCS), originally defined by Côté et al. (2004). This survey is an imaging survey with the Advanced Camera for Surveys (ACS) on board the Hubble Space Telescope on 100 early-type galaxies in the Virgo cluster. The ACSVCS includes only galaxies classified as members of the Virgo cluster according to the Virgo Cluster Catalog (VCC) by Binggeli et al. (1987) with a known radial velocity. All galaxies were chosen to have a total magnitude of BT ≥ 16 mag and are classified as early-types according to Binggeli et al. (1984). Excluding galaxies with strong dust lanes, lacking visible bulge components, or showing tidal interactions leaves a subset of 100 galaxies. Many properties of those galaxies have been derived in the context of the ACSVCS. These include the total stellar mass (Peng et al. 2008) and a distance calibration from surface brightness fluctuations (recalculated by Blakeslee et al. 2009). We have adopted these parameters for the analyses of this paper.
We cross-matched the ACSVCS galaxies with the ViCTORIA LOFAR HBA maps discussed in the following Section 2.2. This yielded a working sample of 12 early-type galaxies in the Virgo cluster, which were detected by LOFAR. This sample overlaps in ten cases with the radio-detected sample of Capetti et al. (2009). We find two additional sources (NGC 4262 and NGC 4621) that were not radio-detected in that work. For two other sources (NGC 4762 and NGC 4550) with compact radio emission found by Capetti et al. (2009), we find no significant radio emission with LOFAR. For the analysis of the extended tails of NGC 4472 (=M 49), we also re-analysed XMM-Newton observations originally published by Su et al. (2019).
2.2. ViCTORIA HBA data
The ViCTORIA HBA survey (Edler et al. 2023) consists of 8 × 8 h of observations conducted using two parallel beams with a central frequency of 144 MHz spread across nine pointings. The covered area of 132 deg−2 contains the Virgo cluster out to at least 1.75× the virial radius (rvir = 3.3°, Simionescu et al. 2017). The data reduction was carried out using a customized and extended version of the strategy that is used for the LOFAR Two-metre Sky Survey (Tasse et al. 2021). After correcting the instrumental systematic effects using observations of bright calibrator sources, a specialised ‘peeling’ strategy was used. This was necessary to mitigate the dynamic range limitations due to the presence of the extremely bright central source, NGC 4486 (M 87, also part of our sample). After obtaining a high-quality source model of NGC 4486 through self-calibration on the source, we accurately calibrated and subtracted the bright source from the visibility data. Subsequently, direction-dependent calibration of the full field could be carried out and the final images were combined to create a mosaic of the field at high (9″ × 5″), low (20″ × 20″) and very low (1′×1′) resolution. The median root-mean-square (rms) noise level of the high-resolution mosaic within the virial radius is 140 μJy beam−1. The systematic uncertainty on the flux density scale was estimated to be 20%.
The detailed description of the data reduction and survey properties can be found in Edler et al. (2023). In this previous work, a catalogue of 112 LOFAR-detected Virgo cluster member galaxies was provided based on a 4σ detection limit in the low-resolution mosaic. For our study, we relaxed this requirement to sources with a statistical significance of at least 4σ in either the high- or low-resolution image. This additionally includes NGC 4262, which is detected at 4.0σ in the high-resolution image but only at 3.6σ in the 20″ map, and NGC 4621, detected at 4.9σ in the high-resolution image and at 3.8σ in the low-resolution image. In total, this leads to 12 galaxies that are part of the ACSVCS and detected at 144 MHz with LOFAR. Of the 100 galaxies in the ACSVCS, six objects are outside the footprint of the ViCTORIA HBA survey, and therefore not part of our analysis. We manually inspected the LOFAR mosaics at the locations of the 82 remaining ACSVCS objects that are covered but not detected by LOFAR to ensure that no sources were missed.
2.3. ViCTORIA MeerKAT data
The ViCTORIA MeerKAT observations are being collected as part of the observing projects MKT22008 in the 2022/23 cycle and MKT23067 in the 2023/24 (PI: de Gasperin) using the L-band receiver system with a central frequency of 1.28 GHz. A total of 320 pointings cover a 112 deg2 region of the cluster in a hexagonal grid with a spacing of 0.58°. The effective exposure time is 43−45 min per pointing. For each observation, the telescope cycled between five target sources and the gain calibrator (J1150−0023) nine times in total to maximise uv coverage. In addition, a bandpass calibrator (J1939−6342) and a polarization calibrator (3C 286) were included in each observation. The observational campaign and the complete data reduction of this project is ongoing. For this study, we carried out the data reduction of the pointings that cover the 12 sources of our LOFAR-ACSVCS sample and the massive elliptical galaxy NGC 4365 for which we detect no compact emission in LOFAR. We considered all pointings that are within 0.4° of at least one of the galaxies; this yielded 1−3 pointings per galaxy. For NGC 4365, which is surrounded by low-surface brightness diffuse emission in the LOFAR maps, we included two more pointings to cover the full diffuse emission in LOFAR; this yielded four pointings for this galaxy.
For each pointing, the following data reduction steps were carried out. Before downloading the data, they were averaged in frequency from an initial channel width of 26.1 kHz to 0.209 MHz and channels outside of the frequency range 900−1650 MHz were removed. The data were then downloaded and further reduced using the ‘Containerized Automated Radio Astronomy Calibration’ (CARACal2) pipeline. First, the data of the bandpass and gain calibrator were flagged using aoflagger (Offringa et al. 2012); we also flagged channels of known radio frequency interference and those corresponding to the 21 cm line (1419.8−1421.3 MHz). Then, the calibrator solutions were derived using a standard CASA-based (McMullin et al. 2007) approach and applied to the target field data. These were subsequently averaged to 16 s in time and 1.67 MHz in frequency as a compromise between data volume and time- and frequency-smearing effects. Next, we carried out flagging of the target field using the tricolour3 flagger and then we proceeded with self-calibration. For the initial model, the field was imaged using WSClean (Offringa et al. 2014). Then, four rounds of self-calibration were carried out using the cubical4 solver and WSClean. In the first round, we solved only for diagonal phase-solutions on 128 s timescales and 3.34 MHz frequency windows. For the further iterations, we also solved for diagonal amplitude solutions (one solution per scan and per 3.34 MHz window), while increasing the frequency resolution of the phase solutions to one solution per channel.
For pointings in the proximity of the extremely bright source, NGC 4486 (=M 87/Virgo A), we ensured that the image region contained the bright source and applied a manual mask containing NGC 4486 during deconvolution. For pointing 46, we needed to additionally peel NGC 4486 from the uv data. For this, we phase-shifted the observation to NGC 4486, carried out ten cycles of self-calibration of the source using a manual cleaning-mask. Then, the final model found for M8 7 was corrupted with the final calibration solutions and subtracted from the dataset. Subsequently, the data were phase-shifted back to the original phase-centre and self-calibrated identical to the other observations.
After self-calibration, the final images were corrected for the effect of the primary beam and neighbouring pointings were combined to a mosaic. To achieve this, a primary beam-corrected image was created for each self-calibrated image. The area below a primary beam attenuation factor of 30% was disregarded. Afterwards, we combined the neighbouring pointings by convolving the primary-beam corrected images to the smallest common circular synthesized beam (between 9.7″ and 12.7″) and re-gridded the images to a common pixel layout. We obtained the final mosaics by taking the average between the overlapping pixels of the individual pointings. The weights were calculated according to the central noise level in the pointing image and the primary beam attenuation factor at the location of each pixel. In total, we created seven mosaics, which cover one to three sources of the sample.
For the flux density scale of the MeerKAT maps, we conservatively assume a systematic uncertainty of 10% (e.g. Knowles et al. 2022). We verified that this assumption is reasonable by comparing the flux density of compact sources between the MeerKAT mosaic to the NRAO VLA Sky Survey (NVSS, Condon et al. 1998).
2.4. Source subtraction
Two of the ACSVCS galaxies (NGC 4365 and NGC 4472) show particularly extended diffuse emission in the LOFAR HBA images, which is not observable in the MeerKAT images at the nominal resolution of ≈10″. To check for the presence of low-surface-brightness diffuse emission in the MeerKAT data, we performed a source subtraction and low-resolution imaging procedure for these targets. For this, each pointing that covers the two sources listed in Table 1 was imaged using WSClean. Here, a uv cut of 3000λ, where λ is the wavelength, was employed to obtain an image containing only compact sources (∼1′ or smaller). From this image, we created a compact-source mask. The mask regions corresponding to the central AGNs in NGC 4365 and NGC 4472 were manually removed so that possible components corresponding to the core of these galaxies would also be included in the low-resolution image. A repeated run of WSClean with the same uv cut but using the compact-source mask was used to create a model of the compact sources in the image (excluding NGC 4365 and NGC 4472). The visibilities corresponding to this model were subtracted from the calibrated uv data of each pointing. This subtracted data was imaged, this time tapering the imaging weights such that the resulting image resolution is 1′. This way, we recovered a low-resolution image of only the extended emission. Lastly, we corrected the low-resolution images for the primary beam and mosaicked them following the procedure described in Section 2.3.
Image properties and flux density measurements of the sample.
2.5. XMM-Newton data
In this work, we reanalysed three XMM-Newton observations of M 49 (ObsID: 0761630101, 0761630201, 0761630301), originally presented in Su et al. (2019). All observations were taken in January 2016, with a total effective exposure time of ∼240 ks. Data analysis was performed using XMM-Newton Science Analysis System (SAS) version (xmmsas_20210317_1624-19.1.0). For details of the data reduction procedure, we refer to Su et al. (2019). Given that MOS1 charge-coupled devices (CCDs) three and six were lost to micrometeorites, only MOS2 and pn were used for imaging analysis, but all of the data were included in the spectrum analysis. We first obtained an exposure- and vignetting-corrected EPIC image in the energy band of 0.7–1.3 keV with the instrumental background subtracted. After removing point sources, we derived its surface brightness profile and fitted it with a double-β profile model. We obtained a residual image after dividing the XMM-Newton image by an azimuthally symmetric image generated from the best-fit double-β model. To obtain a deprojected pressure profile of the ICM, we utilized the southern region in between the two radio tails that we consider to be less affected by stripping or AGN bubbles. We extracted spectra from nine sectional annuli from the centre of M 49 to 96 kpc. We fitted each region to an absorbed thermal emission model, phabs × apec, in XSPEC (version 12.11.1). The temperature, metallicity, and normalisation were allowed to vary freely. The parameters of the astrophysical background (local bubble, Milky Way, and cosmic X-ray background) were taken from Su et al. (2019), determined with offset XMM-Newton pointings. Instrumental backgrounds were modelled with a set of fluorescent instrumental lines (as listed in Table 2 in Su et al. 2017) plus a broken power law with a break at 3 keV. We derived its 3D density profile, ρ(r), assuming its shape follows the deprojection of its surface brightness profile. We then adjusted its amplitude such that the corresponding normalisation profile best matches the one obtained in the spectrum analysis (see Su et al. 2019 for detail). After obtaining ρ(r), we fitted the projected temperature profile to
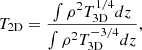 (1)
(1)
where z is along the line of sight and for which we assumed that the deprojected temperature profile, T3D, follows a functional form applicable to cool core clusters (Eq. 1 in Su et al. 2019). We obtained the 3D pressure profile for the quiescent southern region of the ICM by multiplying the 3D temperature and density profiles.
3. Radio analysis of the sample
While the size of our radio-detected sample is limited, it contains the volume of the Virgo cluster, the largest aggregation of early-type galaxies in the nearby Universe. Therefore, we are able to sample AGN with a wide range of radio luminosities (more than six orders of magnitude, from NGC 4262 with 2.3 × 10¹⁹ W Hz−1 to NGC 4486 with 4.1 × 1025 W Hz−1). In this section, we investigate the radio properties of the objects in our sample and explore their connection with the host galaxy parameters.
3.1. Radio morphology
Five of the 12 galaxies in our sample have 3σrms radio contours that are much larger than the beam size of the image. These are NGC 4374, NGC 4472, NGC 4486, NGC 4552, and NGC 4649. We define these objects as extended sources and refer to them as such in the following. They form the most radio-luminous galaxies in our sample with log10L144 ≥ 21.5. All of the extended sources show clear indications of the presence of jets. For NGC 4472, our LOFAR maps reveal for the first time large and diffuse tails extending over 150 kpc, suggesting restarted activity of the central AGN. This source is analysed in detail in Section 4.3.
The other seven sources in the sample show 144 MHz radio emission close to the resolution limit of our LOFAR maps (9″ × 5″). These include three sources showing marginal extension (NGC 4406, NGC 4459, and NGC 4526), which could be due to either the intrinsic size of these sources or alternatively smearing effects in the images related to residual phase errors and the finite time- and frequency resolution of our data.
To analyse whether these sources are truly marginally resolved, we created a source model of a 0.25 square degree sky area around the objects using PyBDSFMohan & Rafferty (2015). The reconstructed full width at half maximum (FWHM) extension of all three sources is at least 8″ larger than the resolution limit in both the major and minor axis. We therefore compared them to the extension of other point sources in the vicinity by considering the ratio of the peak and total flux. For truly unresolved sources in an image with negligible systematic effects, this ratio should approach one (e.g. Figure 6 in Shimwell et al. 2022). The presence of residual systematic effects in the data may introduce an artificial smearing of point sources that should affect point sources of the same flux density in a similar manner. The position of the three sources, however, does not conclusively show whether they are truly point sources or not. In comparison by eye, the MeerKAT images of NGC 4406 and NGC 4526 show a similar ambiguity in their extent, as is seen in the LOFAR images. This is not the case for NGC 4459, which is only slightly more extended than the resolution of the image. However, if the extent of the radio emission were of an intrinsic nature, there is a chance that it could be old emission that is not visible anymore in the MeerKAT observations, making it appear as a point source there.
As we cannot resolve this ambiguity and because we wish to have a clear distinction from the other four sources clearly below the resolution limit, they will be referred to as point-like sources and point sources, respectively.
The LOFAR HBA maps of all sources and the MeerKAT maps of the 11 covered sources are shown in Appendices A and B, respectively, with their half light radius and distance to the central galaxy, NGC 4486, marked.
3.2. Radio emission and stellar mass of host
In Figure 1, we show the 144 MHz luminosity of the sources in the sample plotted against the stellar mass of their host galaxies. For the point and point-like sources, the radio flux densities were measured from the high-resolution maps. For the extended sources, we instead used the low-resolution maps to ensure that the diffuse emission was properly deconvolved. The flux density upper limits of the 144 MHz-undetected sources were included by taking the 4σ noise of the residual images at low resolution close to the position of the sources. For the uncertainty of the flux measurement, both the rms noise, σrms, and the uncertainty of the flux density scale of 20% for the LOFAR HBA maps were accounted for. The flux uncertainty is given by
 (2)
(2)
 |
Fig. 1. Stellar mass against the total radio luminosity for all galaxies in the sample. The different colours in the plot mark their morphological classification: extended sources are shown in red, point-like sources in blue, and point sources are coloured green. The grey points are upper limits derived for the galaxies that were not detected at 144 MHz 4σ. The yellow line shows the best-fitting relation and its 1σ uncertainty band. |
where S is the measured flux. We calculated the luminosity using  , where we used the distances determined with the surface brightness fluctuation method in Blakeslee et al. (2009). Due to the close proximity of the Virgo cluster, we neglected K-correction. The uncertainties of the luminosities were then calculated from the flux uncertainties. The stellar masses of the host galaxies were taken from Peng et al. (2008).
Taking the LOFAR upper limits into account, the sample shows a positive correlation, as is given by the Kendall’s τ correlation coefficient: τ = 0.37 with a p value of p = 1.2 × 10⁻⁶ (if only the detected sources are considered, Kendall’s tau becomes larger, with τ = 0.70). We performed a linear fit to the full sample (including the upper limits) in log space using the Bayesian LInear Regression in Astronomy method (LIRA; Sereno 2016) of the following form:
 (3)
(3)
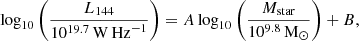
where A and B are the slope and intercept of the correlation, respectively. We find that the radio luminosity of the AGN shows a steep correlation with the mass of their host galaxies. Our best fit parameters for the slope and intercept are
 (4)
(4)
A connection between the radio luminosity and the stellar mass of a galaxy was not unexpected, due to the scaling of the stellar mass with the black hole mass, which in turn scales with its radio emission (Croton et al. 2006). This connection has been found and studied in other works; for example, the work of Bardelli et al. (2010). There, they found that a correlation between the radio luminosity and host galaxy mass only holds up to log10L1.4 = 23.5 W Hz−1. To check whether our observations agree with those of Bardelli et al. (2010), we re-scaled their threshold (calculated for luminosities at 1.4 GHz) to a frequency of 144 MHz, assuming a mean spectral index of α = −0.7. The threshold corresponds to log10L144 = 24.2. Only one source in our sample is brighter than the threshold luminosity. Therefore, the correlation we found is in agreement with the findings of Bardelli et al. (2010).
Another variation is the correlation between the fraction of galaxies above a certain radio luminosity and the mass of the host galaxy. This has been studied in many other publications (e.g. Best et al. 2005; Mauch & Sadler 2007; Capetti et al. 2009; Sabater et al. 2019), in which a strong correlation between the two parameters is found. Such a correlation should also be visible in a plot of the radio luminosity against the mass and can be seen in our data.
Sabater et al. (2019) was able to precisely measure the relation between the fraction of radio-loud galaxies and the host mass and extended it to lower luminosities. They additionally find that all galaxies with M* > 1011 M⊙ are always showing nuclear activity at a level of L150 > 1021 W Hz−1. This result is in agreement with later studies by Grossová et al. (2022) and Capetti et al. (2022), in which they find that all sources above the mentioned mass are at least detected by LOFAR. In the case of Capetti et al. (2022), not all of the galaxies host an active AGN. Some are remnant sources still visible at lower frequencies.
Interestingly, NGC 4365, one of the galaxies in our sample, does not fit this scenario. Despite its high mass of M* > 1011 M⊙, it does not meet our requirement of emitting at a 144 MHz surface-brightness significance of 4σ in either the high- or low-resolution LOFAR maps (corresponding to a 4σ limit of L144 < 6.75 × 10¹⁹ W Hz−1). This indicates that the galaxy is currently in a phase of particularly low activity. A more detailed analysis of the source itself and a possible detection of a previous significantly stronger phase of activity are presented in Section 4.4.
3.3. Radio luminosity and largest linear size
Figure 2 shows the largest linear size (LLS) of the sources in dependence of their 144 MHz radio luminosity. Like the radio flux of the sources, the LLS has been measured in different images for the extended sources and point sources. For the extended sources, we used the low-resolution radio images to determine the extent of the emission. For the point sources, it is only possible to determine an upper limit for the extent of the sources in the high-resolution images. We set the linear size for the four point sources as the resolution limit of the image scaled to the distance of the source. As the radio emission of the three point-like sources seems to extend beyond the resolution limit, we conservatively set the upper limit to the FWHM major axis that we obtained with the PyBDSF source finder (31.6″ for NGC 4406, 25.2″ for NGC 4459, and 36″ for NGC 4526).
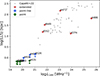 |
Fig. 2. Largest linear size against the total radio luminosity for all radio detected galaxies in the sample. The sources are colour-coded the same way as in Figure 1. Only upper limits in LLS are given for the point and point-like sources. The smaller light grey points are data from Capetti et al. (2022) for a sample of nearby AGN. |
We can see a positive trend between the linear size of the radio emission (including the upper limits of the compact sources) and the radio luminosity, which is reaffirmed by the correlation coefficient and p value (τ = 0.561, p value = 0.009) for our sample. Such a behaviour is consistent with the one found in other samples like de Ruiter et al. (1990) or Capetti et al. (2022). The sample of Capetti et al. (2022), especially, has similar conditions to those of our sample, consisting of radio sources in nearby early-type galaxies and being observed with LOFAR. In Figure 2, we can see that the two samples match in their distribution, confirming a connection between the extent of the radio emission and the luminosity of the sources. By including point sources in this relation that were not considered in Capetti et al. (2022), we are able to extend the analysis to lower luminosities. The point sources show lower luminosities than the extended sources, taking the sample of Capetti et al. (2022) into account.
3.4. Linear size and spectral index
In Figure 3, we compare the linear size of the radio sources with their spectral index between 144 MHz and 1.28 GHz5. To determine the spectral index, the LOFAR and MeerKAT images were convolved and re-gridded to match in their beam size. Then, the radio flux was measured in these images, using the same region as was defined by the emission seen in the LOFAR images for each source. With this, we determined a spectral index for 11 of the 12 sources, as one source was not covered by the MeerKAT observations. Due to the availability of observations in two different frequency bands, we get a solid estimation of the spectral index.
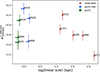 |
Fig. 3. Largest linear size against the total spectral index for 11 of the 12 galaxies that were covered by MeerKAT. The spectral index was calculated using 1.28 GHz and 144 MHz flux measurements. Only upper limits in LLS are given for core-like radio emission. We can potentially see a trend for the extended sources. |
In the plot, we can see a general trend of the extended sources having a flatter spectral index with a smaller linear size. This does not seem to hold true for the point and point-like sources. Here, we can see a spread in the spectral indices from  to
to  . A similar spread in the spectral index of sources that are unresolved on scales between 1.2 and 15 kpc has been found in the work of Capetti et al. (2022). The spectral slopes in their sample show a spread of
 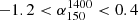 , larger than the one we find. In their sample, however, a larger number of point sources across different environments and distances has been considered, which is likely to produce a larger spread in spectral slopes.
In general, we would suspect some kind of connection between the spectral index of radio sources and the extent of the radio emission, as AGNs with older radio emission, as is implied by the steeper spectral index, have more time for the jets to expand into the surrounding medium than sources with relatively new radio emission. Such a trend has been found for extended radio galaxies by Simonte et al. (2024). Point sources are additionally strongly impacted by synchrotron self-absorption, which flattens the spectral index, so we would expect their spectral index to be generally flatter than the spectral index of extended sources.
The visible radio emission of the AGN jets, however, is also affected by the environment, evolution, and interaction of the host galaxies and the orientation of the jets towards the observer, all of which can affect the spectral index and extent of each source, and therefore cause a scatter in any possible correlation between them. Additionally, it is implied that there is a generally different behaviour of jets in point sources and extended sources. Capetti et al. (2022) find that a majority of the radio sources in early-type galaxies are smaller than 4 kpc. They argue that this implies that the size distribution of radio emission is not determined by age alone but by different jet properties of extended sources and point sources, with the point sources possibly produced by slower jets.
We speculate that a relation between the size of a radio source and the spectral index may only be visible for extended sources. A similarity of the environment of the sources may reduce the scatter in such a potential correlation. In our case, all galaxies are part of the Virgo cluster and the four extended galaxies, with the exception of NGC 4486, show local gas densities of the ICM in the range of 1 × 10⁻⁵ cm−3 to 1 × 10⁻⁴ cm−3 and are therefore very similar. The local gas densities were estimated from the gas density model of the Virgo cluster by McCall et al. (2024).
All the sources that we consider to be extended are resolved and have a radio emission above the resolution limit, making them detectable in their size and spectral index. For point sources, we can only determine an upper limit for the size and the possibility exists that there is extended radio emission present that is well below the detection limit. This makes them a more uncertain sample that could also, due to the possibility of different jet behaviour, have a different or no connection between the spectral index and size.
We additionally analysed six out of the seven compact sources for which we have MeerKAT observations available regarding their spectral shape. To do this, we additionally used the 8.4 GHz VLA observations from Capetti et al. (2009) available for five sources in our sample (NGC 4406, NGC 4435, NGC 4459, NGC 4526, and NGC 4660) and the 8.5 GHz VLA observation for NGC 4621 from Wrobel et al. (2008). With the radio fluxes at three different frequencies available, we were able to calculate the lower spectral index using 144 MHz and 1.28 GHz data and a higher spectral index using 1.28 GHz and 8.4 GHz data. Comparing those two spectral indices gives us information about the radio spectral shape.
Figure 4 shows the two spectral indices of each source plotted against each other. If those were the same, the sources would be situated on the dotted grey line and follow a power-law spectrum. A position below this line indicates a flatter spectral index at lower frequencies, which is the case in self-absorbed sources and spectrally aged ones. In our sample, four sources are situated in that regime. NGC 4459 and NGC 4526 show signs of synchrotron self-absorption due to their flat lower spectral index. NGC 4406 has a steep spectral index at both high and low frequencies, which is in agreement with a spectrally aged source. NGC 4435 shows the strongest deviation of the power-law slope, with a very steep  in comparison to the flatter
  . This could be an indication of a strongly aged source. However, for this source Capetti et al. (2009) found hints of elongation at 8.4 GHz, which are not visible in our LOFAR and MeerKAT observations at lower resolution. This could lead to a lower core flux measured for this source at 8.4 GHz, producing a steeper spectral index. Two compact sources in our sample are situated above the injection power-law line, indicating a flattening of the spectral index towards higher frequencies. One of those sources is NGC 4621. For this source, Wrobel et al. (2008) found an indication of variability in flux measurements at the same frequency but six years apart. The calculation of a spectral index using observations made at different times may therefore not produce a reliable spectral index and the position of the source in the colour-colour plot may be a consequence of this variability.
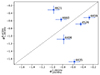 |
Fig. 4. Colour-colour plot for the compact sources. The dotted grey line corresponds to a power-law spectra. |
4. Properties of the extended sources
In this part of our analysis, we take a closer look at the five extended sources in our sample. We especially analyse the radio emission of the galaxy NGC 4472 and its effect on the surrounding ICM. We also analyse the remnant source, NGC 4365, for which no compact emission above the detection limit in LOFAR is observed.
4.1. Spectral index maps
To create spectral index maps for the five extended sources in the sample, we convolved the low-resolution LOFAR and MeerKAT images to match in terms of the synthesised beam size. This results in a resolution of 20″ × 20″. For the extended source, NGC 4472, the spectral index map has a resolution of 62″ × 62″ due to the use of the source-subtracted MeerKAT image, produced with the process explained in Section 2.4. The spectral index was calculated for each pixel in which the emission was above a detection threshold of 3σ in both images. For NGC 4472, the detection threshold was lowered to 2.5σ to highlight the low-surface brightness diffuse emission of this galaxy. Pixels for which a spectral index could be calculated are surrounded by a black contour. In parts where only the LOFAR emission is above the detection threshold, the corresponding upper limit for the spectral index was calculated. These regions are marked with downward-pointing arrows. The spectral index maps are displayed in Figure 5 and the corresponding uncertainty maps can be found in Appendix C.
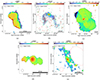 |
Fig. 5. Spectral index maps of the five galaxies with extended radio emission. Dashed red circles mark unrelated sources that were masked. The maps were created using pixels above a 3σ significance in both the 144 MHz LOFAR and 1.28 GHz MeerKAT measurements at the same circular synthesized beam size of 20″, as is indicated by the circle in the lower left corner. The colour scales are different in each image. Upper limits of the spectral index are indicated by downward-pointing arrows. For the low-surface-brightness emission of NGC 4472, we instead used the LOFAR compact source-masked and the MeerKAT compact source-subtracted images at a resolution of 1′ and display pixels above a statistical significance of 2.5σ in both images. (a) NGC4374. (b) NGC4472. (c) NGC4486. (d) NGC4552. (e) NGC4649. |
The lack of visible radio emission in MeerKAT images, where only an upper limit for the spectral index has been calculated, points towards the presence of radiatively old radio emission that experienced spectral steepening. Most prominently, this can be observed for NGC 4472. Here, a wide-angle tail extending over hundreds of kiloparsecs is at this resolution only present in the LOFAR observations of our data. This results in steep spectral indices in these tails of α ≈ −1.6. A more detailed analysis of the radio tails of NGC 4472 is given in Section 4.3.
For the five galaxies with extended radio emission, we can see a flatter spectrum towards the centre with α > −0.6. We would expect such a flattening in the core due to the presence of synchrotron self-absorption. This effect can be strong enough to create an inverted spectral index, as is seen for NGC 4552.
4.2. Equipartition magnetic fields
For the five extended sources, we calculated the equipartition magnetic field strength inside the regions of the radio emission seen by LOFAR. To do this, we used a slightly modified version of the equation given in Beck & Krause (2005):
 (5)
(5)
Here, α is the spectral index of the regarded region, Iν is the intensity of the synchrotron emission at the frequency (ν), Ei is the lower energy cut due to ionisation losses and l is the path length along the line of sight. The factors, c1, c2, and c4, are only dependent on the spectral index and are defined (with different spectral index convention) in Beck & Krause (2005).
This equation holds only under a number of assumptions. We follow the standard assumption that all cosmic rays are accelerated by electromagnetic processes and that there is a strong coupling between them and the magnetic fields. Additionally, we assume that the relativistic plasma of the jets consists of only electrons and positrons without any contribution from protons. The formula we used is only valid for spectral indices with α ≤ −0.5; otherwise, the presence of ionisation or absorption processes may falsify the results. Hence, the core regions for each source have been excluded from this analysis. The lower energy cut was set to γmin = 100 based on the derivations in Falcke & Biermann (1995). To determine the path length, l, we assumed a cylindrical shape of the radio emission. We derived magnetic field strengths of 2 − 10 μG that are collected in Table 2.
Astrophysical properties of the sample.
In the work of Bîrzan et al. (2008), energetics and particle content of the lobes of 24 radio galaxies were analysed, and this included the calculation of the equipartition magnetic field strength for two sources that overlap with our sample. The values calculated for NGC 4374 and NGC 4486 are approximately twice as large as the magnetic field strengths we determined. This may be partly due to the large uncertainties in the calculation of the field strength, as it is based on assumptions about the volume of the radio emission and the particle content in the lobes. Additionally, Bîrzan et al. (2008) used the ‘classical’ equipartition magnetic field strength first proposed by Burbidge (1956). There, the dependence of the integration limits over the synchrotron spectrum on the magnetic field was not taken into account, which can lead to an overestimation of fields with steep spectral index. This could be an explanation for the variation in our results.
4.3. The wide-angle tail of NGC 4472
NGC 4472 is the most massive and optically brightest galaxy in the Virgo cluster. In previous studies at Gigahertz frequencies, this source displayed compact, double-lobed radio emission. Recently, Edler et al. (2023) reported the presence of extended radio tails at 144 MHz. In this section, we analyse the newly found radio tails and determine their interplay with the surrounding ICM.
Each of the two radio tails has a size of about 150 kpc in the LOFAR observations. However, most of this extended radio emission cannot be seen in observations at higher frequencies, as is the case for the MeerKAT observations at 1.28 GHz. To reveal more of the potential diffuse low-surface-brightness emission in the MeerKAT image, we performed a source subtraction and low-resolution imaging procedure, as is explained in Section 2.4, which put a higher emphasis on the large-scale emission of NGC 4472. As is indicated in the spectral index map in Figure 5, the size of the visible radio tails in MeerKAT is still smaller than in LOFAR. We are therefore only able to determine an upper limit for the spectral index in the wide-angle tails of α ≤ −1.8. As was mentioned in Section 4.1, this implies that the wide-angle tail is from an earlier phase of activity of the central AGN, leaving behind old spectral-steepened radio emission.
Looking at the eastern and western radio tails in detail, they show different morphological behaviour. The eastern tail shows especially interesting features, marked in Figure 6 by a dashed blue box. In this part, the radio emission forms a narrow line that seems to be slightly detached from the emission closer to the core of the galaxy. This may possibly hint towards a rather confined magnetic field structure. In the western radio tail, no similar features can be seen. The radio emission seems smooth and uninterrupted. This might indicate, together with the analysis of cavities and the ICM below, that the radio emission in the eastern arm is more affected by differing processes such as the buoyant rise of radio bubbles and the ram pressure stripping, while the western arm seems to be mainly affected by ram pressure stripping. The ram-pressure-stripped X-ray tail of NGC 4472 has been analysed previously in various X-ray studies; for instance, by Biller et al. (2004), Kraft et al. (2011), and Su et al. (2019).
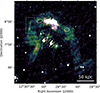 |
Fig. 6. Cavities marked on a low-resolution LOFAR image of NGC 4472. The two cavities marked with white ellipses are the ghost cavities found by Kraft et al. (2011). The dashed blue box marks a part of collimated radio emission. |
To gain a better understanding of the behaviour of NGC 4472 and to analyse the influence and effect of the surrounding ICM, we overlaid the radio contours seen with LOFAR and MeerKAT on the β-model subtracted residual X-ray image (see Section 2.5). This is shown in Figure 7. It is clearly visible that the western X-ray extension coincides strongly with the extended radio emission seen in that part. NGC 4472 seems to be falling onto the Virgo cluster almost perpendicular to the line of sight (Mei et al. 2007). This infall likely causes the ram pressure stripping of the gas forming the extended X-ray tail seen in Figure 7. This has been analysed in depth by Su et al. (2019). The same effect caused the bent shape of the radio jets (Edler et al. 2023). With the radio and X-ray tail overlapping over the full extent of the tail, it is very likely that the X-ray tail is strongly connected to the AGN outburst. This result supports the explanation by Su et al. (2019) that an AGN outburst could have displaced gas from the ISM to larger radii, facilitating the stripping process.
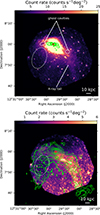 |
Fig. 7. MeerKAT contours on XMM-Newton X-ray image of NGC 4472 (top) and 1′ LOFAR contours on the β-model-subtracted X-ray image (bottom). Contours start at 3σ and increase in powers of two, where σ = 17 μJy/beam for MeerKAT and 1σ = 1 mJy/beam for LOFAR. The centre of NGC 4472 is marked with a red cross. |
Surprisingly, we do not see a similar behaviour in the eastern radio lobe of the source. Despite the bent shape of the radio jet, as is the case in the western tail, we do not see enhanced X-ray emission. Instead, we see a depression of surface brightness with its centre at a distance of ∼24 kpc from the galaxy centre. A comparison of the count rate in this area with the surrounding space alone does not yield a statistically significant lack of X-ray emission, with the values being within 2σ of each other. However, the shape of the surface brightness depression follows the shape of the radio tail closely, strongly implying that this feature is indeed an X-ray cavity. We therefore measured the size of this cavity and made an estimate of the jet power.
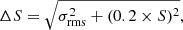
To determine the volume, we assumed an ellipsoidal shape of the cavity with its size along the line of sight the same as the semi-minor axis of the ellipse fitted to it. To calculate the enthalpy required to inflate the cavity given by Ecav = 4 pV, we used the deprojected pressure of the ICM close to the cavity. The pressure was calculated using the temperature and density profiles derived from a region between the two radio arms as explained in Section 2.5. We estimated the age of the cavity using the buoyancy timescale given by Bîrzan et al. (2004):
 (6)
(6)
where R is the projected radial distance to the centre of NGC 4472, S is the cross-sectional area of the cavity, C is the drag coefficient chosen to be C = 0.75 (Churazov et al. 2001), V is the volume of the cavity, and g is the gravitational acceleration. We followed Bîrzan et al. (2004) and approximated the gravitational acceleration with g ≈ 2vσ2/R with the stellar velocity dispersion of NGC 4472 given as  (Côté et al. 2003). We find an age of tbuoy ≈ 83 Myr. We computed the cavity power of this cavity to be Pcav = 2.18 × 1042 erg s−1.
In comparison to the age of the cavity, the time it takes for the X-ray tail to form is estimated to be 100 − 220 Myr (Su et al. 2019). For an AGN outburst, we would expect the radio tails to form on similar timescales. As the X-ray emission seen in NGC 4472 seems to be correlated with the radio tails as well, we would expect the cavity to have a similar age as the X-ray tail. There are, however, multiple ways in which one can explain this difference in timescales. The cavity age we derived in this paper is more likely to be a lower limit of the actual cavity age. To estimate it, we used the radial distance of the cavity to the centre of NGC 4472. With the shape of the radio tails, however, it is more likely that the radio emission had a more complicated path towards its position, which would result in an older age of the cavity. Additionally, NGC 4472 is falling into the Virgo cluster in the northeast direction and experiences ram pressure stripping towards the southwest (Su et al. 2019). This could affect the two jets of the central AGN differently in their evolution and timescales, with the western jet produced in the approximate direction of the stripping and the eastern jet more orthogonal to it.
NGC 4472 contains another set of cavities located at a distance of 3.6 kpc from the galaxy centre. They have been found and analysed in the work of Biller et al. (2004). There, they found that these cavities were produced by an AGN outburst that began at least 1.2 × 10⁷ yr ago and may still be active today. As the cavity we found was produced approximately 83 Myr ago and due to the fact that the radio emission filling this cavity is only visible at very low frequencies, we believe that these cavities have been produced by two separate outbursts of the AGN. The estimated jet power of the cavities found by Biller et al. (2004) is Pcav ≈ 0.5 × 1042 erg s−1 (Cavagnolo et al. 2010). This jet power is approximately as high as the jet power we estimated for the previous outburst of the AGN, implying that the two outbursts are similar in strength.
NGC 4472 may harbour two other cavities at larger distances from the centre of the galaxy, as has been proposed by Kraft et al. (2011). In X-ray observations of the source they found cool filamentary arms, implying the existence of cavities from a previous outburst of the AGN. The presence of these filaments has been confirmed in a deeper X-ray study by Su et al. (2019) and can be seen in the lower image of Figure 7. For cavities produced by the buoyant rise of radio bubbles, we would expect them to be filled with radio emission. This does not seem to be the case for the eastern cavity. Here, it seems that on the contrary the radio emission declines in a region close to the cavity. This depression of radio emission is approximately of the same size as the cavity but slightly offset from the exact position. We therefore cannot conclusively determine whether this is a real cavity. The western ghost cavity on the other hand is radio-filled.
However, we used only the cavity power calculated for the single cavity found in this paper as an estimation of the total jet power of the AGN for the past duty cycle. To check whether our estimated jet power is reasonable, we determined its position in the jet power against radio luminosity plot. A scaling relation in this plot has been found in earlier work (e.g. by Bîrzan et al. 2004, 2008; Cavagnolo et al. 2010; O’Sullivan et al. 2011) at higher frequencies. Here, we used the data and sample assembled by Bîrzan et al. (2020) to create a plot at 144 MHz, which can be seen in Figure 8. The references for calculating these cavity powers can be found in Bîrzan et al. (2020)
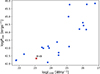 |
Fig. 8. Cavity power against the total radio luminosity of each source. The plot was created using the data from Bîrzan et al. (2020). The point marked as a red square was added using the cavity power estimated for NGC 4472 (M 49) in this work. |
As the cavity is located at a greater distance from the centre of the galaxy, an age estimation of a buoyantly rising bubble is quite high. The jet power derived from this is therefore at the lower end of the compared to the jet power of other sources gathered in the sample. With the radio luminosity of NGC 4472 being on the lower side as well, the cavity fits into the correlation. However, as the scatter in the plot is quite large, this is only a weak indication that we have found a real cavity.
4.4. Remnant source, NGC 4365
In this section, we take a closer look at NGC 4365, a giant early-type galaxy that is the dominant object in the W′ cloud in the background of the Virgo cluster (d = 23.3 Mpc). Like the centres of other substructures in the Virgo cluster, it was likely formed during a major merging event (Boselli et al. 2014).
For this galaxy, we can rule out compact radio emission with a luminosity above L144 = 6.75 × 10¹⁹ W Hz−1, meaning that this galaxy is surprisingly passive for its mass (compare e.g. Sabater et al. 2019). In the low-resolution LOFAR images, we can instead see very diffuse radio emission extending over approximately 3790 arcsec, which corresponds to 428 kpc. This emission surrounds the optical position of NGC 4365, as has been found by Edler et al. (2023) and as can be seen in Figure 9.
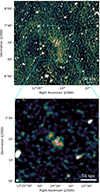 |
Fig. 9. Low-resolution radio map of the diffuse emission surrounding NGC 4365 at 144 MHz (LOFAR, top panel). The bottom panel shows the area corresponding to the cyan box in the MeerKAT compact-source-subtracted map at 60″. The white circle in the middle of both images marks the half-light radius in the r band of NGC 4365. |
The radio emission seen with LOFAR is not necessarily connected to NGC 4365. In eROSITA observations, McCall et al. (2024) found X-ray emission extending from the NGC 4472 group over the W′ cloud. They argue that based on the coincident position and morphology the radio emission is connected to the X-ray and caused by accretion shocks or turbulence in the hot plasma (van Weeren et al. 2019).
Hints as to whether the radio emission stems from NGC 4365 or from other causes can be found in the MeerKAT observations. As the radio emission is very diffuse in the LOFAR images, we expected any possible extended radio emission to be diffuse in the MeerKAT images as well. We therefore created a source-subtracted radio image to highlight faint extended emission, as is explained in Section 2.4. This image is shown in Figure 9. Here, we can see a faint point source at the optical position of NGC 4365, which sits at the centre of diffuse radio emission surrounding it. Its extension of ≈70 kpc is much less than the radio emission seen with LOFAR with a size of ∼600″.
We conclude that the emissions seen at the two different frequencies are connected to each other and originate from a past AGN outburst of NGC 4365. The missing point source in the LOFAR observations of NGC 4365 could be very faint and not differentiable from the extended emission. In that case, the X-ray extension found by McCall et al. (2024) may not be connected to the extended radio emission seen with LOFAR and coincidentally shows the same orientation.
Based on the compact-source-subtracted MeerKAT and the compact-source-masked LOFAR maps at a resolution of 1′, we created a spectral index map of the extended emission. For the much larger extent of the radio emission in LOFAR, we can estimate an upper limit of the spectral index. This is shown in Figure 10; the corresponding uncertainty map can be found in Appendix C.
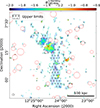 |
Fig. 10. Spectral index map of NGC 4365 (black cross). Dashed red circles mark unrelated sources that were masked. Upper limits are marked by downward-pointing arrows. The synthesized beam size and linear size at the distance of the source are marked at the bottom. |
In the map, we can see that the source generally has a very steep spectrum. The spectral index is slightly flatter in the centre with a value of α ∼ −1.1. At larger distances from the galaxy, the emission becomes steeper until it is only detected in LOFAR and we can only determine an upper limit of α < −1.6. This is in agreement with remnant AGN emission from a previous AGN outburst with a spectral index gradient pointing towards older plasma further away from NGC 4365. Thus, while the galaxy appears to be particularly passive in the present day (see Figure 1), it likely was significantly more active in the past and is now in the remnant AGN stage.
5. Conclusions
In this work, we analysed the radio properties of a sample of 94 early-type galaxies in the Virgo cluster using LOFAR data at 144 MHz. Twelve of these galaxies were detected at a significance of 4σ in LOFAR. We determined the relations between the radio luminosity, mass of the host galaxy, and LLS of the emission. Data from MeerKAT L-band observations was available for 11 galaxies in the sample, making an analysis of the spectral properties possible. The main results for the statistical analysis of the sample are:
-
We find a correlation between the observed radio luminosity and the stellar mass of the host galaxy. This is consistent with the results in Sabater et al. (2019) and the expectation from relations between the mass and fraction of radio-observed galaxies (e.g. Best et al. 2005; Sabater et al. 2019).
-
We can confirm a positive connection between the radio luminosity and linear size of the sources, in agreement with Capetti et al. (2022).
-
We find hints of a possible correlation between the spectral index and the linear size of the sources. The larger sources show steeper radio continuum spectra. We speculate that this may only be visible for extended sources in similar environments.
Special consideration was given to NGC 4472, which was analysed in relation to the interaction between the radio lobes and the X-ray emitting ICM. Furthermore, we investigated in more detail the galaxy NGC 4365, which was not detected at a 4σ level in LOFAR observations, making it particularly radio-passive for a galaxy of its mass. The results of this study on individual galaxies are:
-
The co-evolution of the thermal plasma and the cosmic ray electrons in the eastern and western tails of NGC 4472 is drastically different. While the western tail is dominated by ram pressure stripping (see also Su et al. 2019), the eastern tail hints at a cavity that is inflated by the radio emission. The cavity power is Pcav = 2.18 × 1042 erg s−1, which sits at the lower end in a cavity power – radio luminosity correlation.
-
Comparing two different duty cycles in NGC 4472 based on the jet powers of two outbursts yields that the past outburst is of the same order as the present one.
-
We cannot confirm the existence of the previously found eastern ghost cavity in NGC 4472 with our radio data. Rather, it seems that the radio emission declines at its position.
-
A notable outlier from the stellar mass-luminosity relation is NGC 4365, which does not exhibit significant compact radio emission in spite of its high mass.
-
NGC 4365 is surrounded by diffuse low-surface-brightness emission at 144 MHz with an extent of ∼1° (410 kpc at the distance of NGC 4365). This emission is only partly visible in MeerKAT after low-resolution imaging, which suggests that this emission is steep-spectrum (with α < −1.6 in the extended tails seen only with LOFAR). We interpret it as fossil radio galaxy plasma from a past AGN outburst.
These results are based on the analysis of a relatively small set of sources. A larger sample needs to be studied to strengthen the statistical result. All the sources analysed are part of sub-structures belonging to the same galaxy cluster. Therefore, some of the connections found here may be more challenging to recover in a sample of sources in more diverse astrophysical surroundings. A more conclusive picture, especially in regards to the possible connection between the spectral index and the linear size, could be achieved by analysing a larger sample of AGNs over various clusters and in comparison to field galaxies.
For the extended steep-spectrum emission of NGC 4472 and NGC 4365, studies at even lower frequencies are important to establish a more coherent picture, in particular to model the spectral ageing. The observations of our ongoing ViCTORIA LOFAR LBA survey at frequencies of 42 − 66 MHz will allow us to confirm our interpretation of the radio emission. For both galaxies, the LOFAR LBA observations may reveal even older and even more distant radio plasma. The extended radio tails of NGC 4472 are at their furthest point not visible in the MeerKAT observations. Therefore, only upper limits for the spectral index can be estimated in these regions. With the LBA data, it is possible to determine spectral index maps for the tails and do a proper spectral analysis that sheds more light on the properties of this past outburst. The LBA observations may also potentially be decisive for the question of whether the diffuse radio emission is connected to NGC 4365 or has another origin.
For NGC 4472, the structure of the radio emission in the eastern arm poses an additional research topic. In the discussion above, we speculated that the narrow jet-like form of the radio emission may arise from a structured magnetic filed. This idea can be confirmed or disproved with a polarisation analysis of NGC 4472.
Data availability
The reduced mosaics are available at the CDS via anonymous ftp to cdsarc.cds.unistra.fr (130.79.128.5) or via https://cdsarc.cds.unistra.fr/viz-bin/cat/J/A+A/690/A195
The spectral indices α are defined as Fν ∝ να.
Acknowledgments
HE acknowledges support by the Deutsche Forschungsgemeinschaft (DFG, German Research Foundation) under project number 427771150. MB acknowledges funding by the Deutsche Forschungsgemeinschaft (DFG, German Research Foundation) under Germany’s Excellence Strategy – EXC 2121 “Quantum Universe” – 390833306 and project number 443220636 (DFG research unit FOR 5195: “Relativistic Jets in Active Galaxies”). FdG acknowledges support from the ERC Consolidator Grant ULU 101086378. The MeerKAT telescope is operated by the South African Radio Astronomy Observatory, which is a facility of the National Research Foundation, an agency of the Department of Science and Innovation. Part of the data published here have been reduced using the CARACal pipeline, partially supported by ERC Starting grant number 679627 “FORNAX”, MAECI Grant Number ZA18GR02, DST-NRF Grant Number 113121 as part of the ISARP Joint Research Scheme, and BMBF project 05A17PC2 for D-MeerKAT. Information about CARACal can be obtained online under the URL: https://caracal.readthedocs.io. LOFAR (van Haarlem et al. 2013) is the Low Frequency Array designed and constructed by ASTRON. It has observing, data processing, and data storage facilities in several countries, which are owned by various parties (each with their own funding sources), and that are collectively operated by the ILT foundation under a joint scientific policy. The ILT resources have benefited from the following recent major funding sources: CNRS-INSU, Observatoire de Paris and Université d’Orléans, France; BMBF, MIWF-NRW, MPG, Germany; Science Foundation Ireland (SFI), Department of Business, Enterprise and Innovation (DBEI), Ireland; NWO, The Netherlands; The Science and Technology Facilities Council, UK; Ministry of Science and Higher Education, Poland; The Istituto Nazionale di Astrofisica (INAF), Italy. This research made use of the Dutch national e-infrastructure with support of the SURF Cooperative (e-infra 180169) and the LOFAR e-infra group. The Jülich LOFAR Long Term Archive and the German LOFAR network are both coordinated and operated by the Jülich Supercomputing Centre (JSC), and computing resources on the supercomputer JUWELS at JSC were provided by the Gauss Centre for Supercomputing e.V. (grant CHTB00) through the John von Neumann Institute for Computing (NIC). This research made use of the University of Hertfordshire high-performance computing facility and the LOFAR-UK computing facility located at the University of Hertfordshire and supported by STFC [ST/P000096/1], and of the Italian LOFAR IT computing infrastructure supported and operated by INAF, and by the Physics Department of Turin university (under an agreement with Consorzio Interuniversitario per la Fisica Spaziale) at the C3S Supercomputing Centre, Italy.
References
- Bardelli, S., Schinnerer, E., Smolčic, V., et al. 2010, A&A, 511, A1 [NASA ADS] [CrossRef] [EDP Sciences] [Google Scholar]
- Beck, R., & Krause, M. 2005, Astron. Nachr., 326, 414 [Google Scholar]
- Best, P. N., Kauffmann, G., Heckman, T. M., et al. 2005, MNRAS, 362, 25 [Google Scholar]
- Biller, B. A., Jones, C., Forman, W. R., Kraft, R., & Ensslin, T. 2004, ApJ, 613, 238 [NASA ADS] [CrossRef] [Google Scholar]
- Binggeli, B., Sandage, A., & Tarenghi, M. 1984, AJ, 89, 64 [NASA ADS] [CrossRef] [Google Scholar]
- Binggeli, B., Tammann, G. A., & Sandage, A. 1987, AJ, 94, 251 [Google Scholar]
- Bîrzan, L., Rafferty, D. A., McNamara, B. R., Wise, M. W., & Nulsen, P. E. J. 2004, ApJ, 607, 800 [Google Scholar]
- Bîrzan, L., McNamara, B. R., Nulsen, P. E. J., Carilli, C. L., & Wise, M. W. 2008, ApJ, 686, 859 [Google Scholar]
- Bîrzan, L., Rafferty, D. A., Brüggen, M., et al. 2020, MNRAS, 496, 2613 [CrossRef] [Google Scholar]
- Blakeslee, J. P., Jordán, A., Mei, S., et al. 2009, ApJ, 694, 556 [Google Scholar]
- Boselli, A., Voyer, E., Boissier, S., et al. 2014, A&A, 570, A69 [NASA ADS] [CrossRef] [EDP Sciences] [Google Scholar]
- Burbidge, G. R. 1956, ApJ, 124, 416 [NASA ADS] [CrossRef] [Google Scholar]
- Cantiello, M., Blakeslee, J. P., Ferrarese, L., et al. 2018, ApJ, 856, 126 [Google Scholar]
- Capetti, A., Kharb, P., Axon, D. J., Merritt, D., & Baldi, R. D. 2009, AJ, 138, 1990 [NASA ADS] [CrossRef] [Google Scholar]
- Capetti, A., Brienza, M., Balmaverde, B., et al. 2022, A&A, 660, A93 [NASA ADS] [CrossRef] [EDP Sciences] [Google Scholar]
- Cavagnolo, K. W., McNamara, B. R., Nulsen, P. E. J., et al. 2010, ApJ, 720, 1066 [Google Scholar]
- Churazov, E., Brüggen, M., Kaiser, C. R., Böhringer, H., & Forman, W. 2001, ApJ, 554, 261 [NASA ADS] [CrossRef] [Google Scholar]
- Condon, J. J., Cotton, W. D., Greisen, E. W., et al. 1998, AJ, 115, 1693 [Google Scholar]
- Côté, P., McLaughlin, D. E., Cohen, J. G., & Blakeslee, J. P. 2003, ApJ, 591, 850 [CrossRef] [Google Scholar]
- Côté, P., Blakeslee, J. P., Ferrarese, L., et al. 2004, ApJS, 153, 223 [Google Scholar]
- Croton, D. J., Springel, V., White, S. D. M., et al. 2006, MNRAS, 365, 11 [Google Scholar]
- de Ruiter, H. R., Parma, P., Fanti, C., & Fanti, R. 1990, A&A, 227, 351 [NASA ADS] [Google Scholar]
- Edler, H. W., de Gasperin, F., Shimwell, T. W., et al. 2023, A&A, 676, A24 [NASA ADS] [CrossRef] [EDP Sciences] [Google Scholar]
- Fabian, A. C. 2012, ARA&A, 50, 455 [Google Scholar]
- Falcke, H., & Biermann, P. L. 1995, A&A, 293, 665 [NASA ADS] [Google Scholar]
- Ferrarese, L., & Merritt, D. 2000, ApJ, 539, L9 [Google Scholar]
- Ferrarese, L., Côté, P., Cuillandre, J.-C., et al. 2012, ApJS, 200, 4 [Google Scholar]
- Grossová, R., Werner, N., Massaro, F., et al. 2022, ApJS, 258, 30 [CrossRef] [Google Scholar]
- Harwood, J. J., Hardcastle, M. J., Croston, J. H., & Goodger, J. L. 2013, MNRAS, 435, 3353 [NASA ADS] [CrossRef] [Google Scholar]
- Hoyle, F., & Fowler, W. A. 1963, MNRAS, 125, 169 [Google Scholar]
- Hu, Z., Su, Y., Li, Z., et al. 2023, ApJ, 956, 104 [NASA ADS] [CrossRef] [Google Scholar]
- Jaffe, W. J., & Perola, G. C. 1973, A&A, 26, 423 [NASA ADS] [Google Scholar]
- Kardashev, N. S. 1962, Sov. Astron., 6, 317 [NASA ADS] [Google Scholar]
- Kim, S., Rey, S.-C., Jerjen, H., et al. 2014, ApJS, 215, 22 [Google Scholar]
- Knowles, K., Cotton, W. D., Rudnick, L., et al. 2022, A&A, 657, A56 [NASA ADS] [CrossRef] [EDP Sciences] [Google Scholar]
- Kormendy, J., & Ho, L. C. 2013, ARA&A, 51, 511 [Google Scholar]
- Kraft, R. P., Forman, W. R., Jones, C., et al. 2011, ApJ, 727, 41 [NASA ADS] [CrossRef] [Google Scholar]
- Malavasi, N., Bardelli, S., Ciliegi, P., et al. 2015, A&A, 576, A101 [NASA ADS] [CrossRef] [EDP Sciences] [Google Scholar]
- Mauch, T., & Sadler, E. M. 2007, MNRAS, 375, 931 [Google Scholar]
- McCall, H., Reiprich, T. H., Veronica, A., et al. 2024, A&A, 689, A113 [NASA ADS] [CrossRef] [EDP Sciences] [Google Scholar]
- McMullin, J. P., Waters, B., Schiebel, D., Young, W., & Golap, K. 2007, ASP Conf. Ser., 376, 127 [Google Scholar]
- McNamara, B. R., & Nulsen, P. E. J. 2012, New J. Phys., 14, 055023 [NASA ADS] [CrossRef] [Google Scholar]
- Mei, S., Blakeslee, J. P., Côté, P., et al. 2007, ApJ, 655, 144 [Google Scholar]
- Mohan, N., & Rafferty, D. 2015, Astrophysics Source Code Library [record ascl:1502.007] [Google Scholar]
- Offringa, A. R., van de Gronde, J. J., & Roerdink, J. B. T. M. 2012, A&A, 539, A95 [NASA ADS] [CrossRef] [EDP Sciences] [Google Scholar]
- Offringa, A. R., McKinley, B., Hurley-Walker, N., et al. 2014, MNRAS, 444, 606 [Google Scholar]
- O’Sullivan, E., Giacintucci, S., David, L. P., et al. 2011, ApJ, 735, 11 [Google Scholar]
- Peng, E. W., Jordán, A., Côté, P., et al. 2008, ApJ, 681, 197 [NASA ADS] [CrossRef] [Google Scholar]
- Rafferty, D. A., McNamara, B. R., Nulsen, P. E. J., & Wise, M. W. 2006, ApJ, 652, 216 [NASA ADS] [CrossRef] [Google Scholar]
- Sabater, J., Best, P. N., & Argudo-Fernández, M. 2013, MNRAS, 430, 638 [Google Scholar]
- Sabater, J., Best, P. N., Hardcastle, M. J., et al. 2019, A&A, 622, A17 [NASA ADS] [CrossRef] [EDP Sciences] [Google Scholar]
- Sereno, M. 2016, MNRAS, 455, 2149 [Google Scholar]
- Shabala, S. S., Jurlin, N., Morganti, R., et al. 2020, MNRAS, 496, 1706 [NASA ADS] [CrossRef] [Google Scholar]
- Shimwell, T. W., Hardcastle, M. J., Tasse, C., et al. 2022, A&A, 659, A1 [NASA ADS] [CrossRef] [EDP Sciences] [Google Scholar]
- Simionescu, A., Werner, N., Mantz, A., Allen, S. W., & Urban, O. 2017, MNRAS, 469, 1476 [Google Scholar]
- Simonte, M., Andernach, H., Brüggen, M., Miley, G. K., & Barthel, P. 2024, A&A, 686, A21 [NASA ADS] [CrossRef] [EDP Sciences] [Google Scholar]
- Su, Y., Nulsen, P. E. J., Kraft, R. P., et al. 2017, ApJ, 851, 69 [Google Scholar]
- Su, Y., Kraft, R. P., Nulsen, P. E. J., et al. 2019, AJ, 158, 6 [NASA ADS] [CrossRef] [Google Scholar]
- Tasse, C., Shimwell, T., Hardcastle, M. J., et al. 2021, A&A, 648, A1 [EDP Sciences] [Google Scholar]
- Urban, O., Werner, N., Simionescu, A., Allen, S. W., & Böhringer, H. 2011, MNRAS, 414, 2101 [NASA ADS] [CrossRef] [Google Scholar]
- van Haarlem, M. P., Wise, M. W., Gunst, A. W., et al. 2013, A&A, 556, A2 [NASA ADS] [CrossRef] [EDP Sciences] [Google Scholar]
- van Weeren, R. J., de Gasperin, F., Akamatsu, H., et al. 2019, Space Sci. Rev., 215, 16 [Google Scholar]
- Vanden Berk, D. E., Shen, J., Yip, C.-W., et al. 2006, AJ, 131, 84 [CrossRef] [Google Scholar]
- Wrobel, J. M., Terashima, Y., & Ho, L. C. 2008, ApJ, 675, 1041 [NASA ADS] [CrossRef] [Google Scholar]
Appendix A: LOFAR images of sample sources
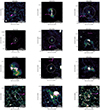 |
Fig. A.1. LOFAR image of the 12 sources in the sample at 144 MHz. Each source is overlaid with the half light radius in the r band of its host galaxy (white circle) taken from Kim et al. (2014) The pink arrow marks the direction and physical distance towards the centre of the Virgo cluster (NGC 4486). The ellipse in the lower left corner indicates the beam size 9″ × 5″ for all images with the exception of NGC 4472 and NGC 4649. Here, the ellipse indicates a beam size of 20″ × 20″ as the low-resolution LOFAR images are plotted. |
Appendix B: MeerKAT images of sample sources
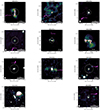 |
Fig. B.1. MeerKAT image at 1.28 GHz of 11 of the 12 sources from the sample covered by MeerKAT observations. As before, each source is overlaid with the half light radius in the r band of its host galaxy (white circle) taken from Kim et al. (2014). The pink arrow in each image marks the direction and physical distance towards the centre of the Virgo cluster (NGC 4486). The ellipse in the lower left corner indicates the beam size between 9.7″ and 12.7″ |
Appendix C: Spectral index uncertainty maps
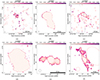 |
Fig. C.1. Spectral index uncertainty maps of the six galaxies with extended radio emission. Dashed red circles mark unrelated sources that were masked. The uncertainties include the systematic uncertainty on the flux density scale for LOFAR at 20% and for MeerKAT at 10%. |
All Tables
All Figures
|
Fig. 1. Stellar mass against the total radio luminosity for all galaxies in the sample. The different colours in the plot mark their morphological classification: extended sources are shown in red, point-like sources in blue, and point sources are coloured green. The grey points are upper limits derived for the galaxies that were not detected at 144 MHz 4σ. The yellow line shows the best-fitting relation and its 1σ uncertainty band. |
| In the text | |
|
Fig. 2. Largest linear size against the total radio luminosity for all radio detected galaxies in the sample. The sources are colour-coded the same way as in Figure 1. Only upper limits in LLS are given for the point and point-like sources. The smaller light grey points are data from Capetti et al. (2022) for a sample of nearby AGN. |
| In the text | |
|
Fig. 3. Largest linear size against the total spectral index for 11 of the 12 galaxies that were covered by MeerKAT. The spectral index was calculated using 1.28 GHz and 144 MHz flux measurements. Only upper limits in LLS are given for core-like radio emission. We can potentially see a trend for the extended sources. |
| In the text | |
|
Fig. 4. Colour-colour plot for the compact sources. The dotted grey line corresponds to a power-law spectra. |
| In the text | |
|
Fig. 5. Spectral index maps of the five galaxies with extended radio emission. Dashed red circles mark unrelated sources that were masked. The maps were created using pixels above a 3σ significance in both the 144 MHz LOFAR and 1.28 GHz MeerKAT measurements at the same circular synthesized beam size of 20″, as is indicated by the circle in the lower left corner. The colour scales are different in each image. Upper limits of the spectral index are indicated by downward-pointing arrows. For the low-surface-brightness emission of NGC 4472, we instead used the LOFAR compact source-masked and the MeerKAT compact source-subtracted images at a resolution of 1′ and display pixels above a statistical significance of 2.5σ in both images. (a) NGC4374. (b) NGC4472. (c) NGC4486. (d) NGC4552. (e) NGC4649. |
| In the text | |
|
Fig. 6. Cavities marked on a low-resolution LOFAR image of NGC 4472. The two cavities marked with white ellipses are the ghost cavities found by Kraft et al. (2011). The dashed blue box marks a part of collimated radio emission. |
| In the text | |
|
Fig. 7. MeerKAT contours on XMM-Newton X-ray image of NGC 4472 (top) and 1′ LOFAR contours on the β-model-subtracted X-ray image (bottom). Contours start at 3σ and increase in powers of two, where σ = 17 μJy/beam for MeerKAT and 1σ = 1 mJy/beam for LOFAR. The centre of NGC 4472 is marked with a red cross. |
| In the text | |
|
Fig. 8. Cavity power against the total radio luminosity of each source. The plot was created using the data from Bîrzan et al. (2020). The point marked as a red square was added using the cavity power estimated for NGC 4472 (M 49) in this work. |
| In the text | |
|
Fig. 9. Low-resolution radio map of the diffuse emission surrounding NGC 4365 at 144 MHz (LOFAR, top panel). The bottom panel shows the area corresponding to the cyan box in the MeerKAT compact-source-subtracted map at 60″. The white circle in the middle of both images marks the half-light radius in the r band of NGC 4365. |
| In the text | |
|
Fig. 10. Spectral index map of NGC 4365 (black cross). Dashed red circles mark unrelated sources that were masked. Upper limits are marked by downward-pointing arrows. The synthesized beam size and linear size at the distance of the source are marked at the bottom. |
| In the text | |
|
Fig. A.1. LOFAR image of the 12 sources in the sample at 144 MHz. Each source is overlaid with the half light radius in the r band of its host galaxy (white circle) taken from Kim et al. (2014) The pink arrow marks the direction and physical distance towards the centre of the Virgo cluster (NGC 4486). The ellipse in the lower left corner indicates the beam size 9″ × 5″ for all images with the exception of NGC 4472 and NGC 4649. Here, the ellipse indicates a beam size of 20″ × 20″ as the low-resolution LOFAR images are plotted. |
| In the text | |
|
Fig. B.1. MeerKAT image at 1.28 GHz of 11 of the 12 sources from the sample covered by MeerKAT observations. As before, each source is overlaid with the half light radius in the r band of its host galaxy (white circle) taken from Kim et al. (2014). The pink arrow in each image marks the direction and physical distance towards the centre of the Virgo cluster (NGC 4486). The ellipse in the lower left corner indicates the beam size between 9.7″ and 12.7″ |
| In the text | |
|
Fig. C.1. Spectral index uncertainty maps of the six galaxies with extended radio emission. Dashed red circles mark unrelated sources that were masked. The uncertainties include the systematic uncertainty on the flux density scale for LOFAR at 20% and for MeerKAT at 10%. |
| In the text | |
Current usage metrics show cumulative count of Article Views (full-text article views including HTML views, PDF and ePub downloads, according to the available data) and Abstracts Views on Vision4Press platform.
Data correspond to usage on the plateform after 2015. The current usage metrics is available 48-96 hours after online publication and is updated daily on week days.
Initial download of the metrics may take a while.