| Issue |
A&A
Volume 693, January 2025
|
|
|---|---|---|
| Article Number | A189 | |
| Number of page(s) | 12 | |
| Section | Extragalactic astronomy | |
| DOI | https://doi.org/10.1051/0004-6361/202452060 | |
| Published online | 17 January 2025 | |
The ViCTORIA project
Description of a multi-frequency radio survey of the Virgo galaxy cluster
1
INAF – Istituto di Radioastronomia, via P. Gobetti 101, 40129 Bologna, Italy
2
Hamburger Sternwarte, Universität Hamburg, Gojenbergsweg 112, 21029 Hamburg, Germany
3
Aix Marseille Univ, CNRS, CNES, LAM, Marseille, France
4
Osservatorio Astronomico di Cagliari, Via della Scienza 5, 09047 Selargius (CA), Italy
5
Dipartimento di Fisica G.Occhialini, Università degli Studi di Milano-Bicocca, Piazza della Scienza 3, 20126 Milano, Italy
6
Max-Planck-Institut für extraterrestrische Physik (MPE), Giessenbachstrasse1, 85748 Garching bei München, Germany
7
Argelander-Institut für Astronomie (AIfA), Universität Bonn, Auf dem Hügel 71, 53121 Bonn, Germany
8
Kapteyn Astronomical Institute, University of Groningen, P.O. Box 800 9700 AV Groningen, The Netherlands
⋆ Corresponding author; fdg@ira.inaf.it
Received:
30
August
2024
Accepted:
25
November
2024
The Virgo cluster is the closest and richest nearby galaxy cluster. It is still in the formation process, with a number of sub-clusters undergoing merging and interactions. Although a great laboratory to study galaxy evolution and cluster formation, its large apparent size and the severe dynamic range limitations due to the presence of the bright radio source Virgo A (M 87) reduced the ability of past wide-area radio surveys to image the region with high levels of sensitivity and fidelity. In this paper we describe the Virgo Cluster multi-Telescope Observations in Radio of Interacting galaxies and AGN (ViCTORIA) project. The survey and its data reduction strategy are designed to mitigate the challenges of this field and deliver images from 42 MHz to 1.7 GHz frequencies of the Virgo cluster about 60 times deeper than existing data; final deliberables will include polarisation images and a blind H I survey aimed at mapping seven times more galaxies than previous experiments without selection biases. Data have been collected with the Low-Frequency Array (LOFAR) using both the Low Band Antenna (LBA) and the High Band Antenna (HBA) systems and with MeerKAT in L-band, including polarisation and enough frequency resolution to conduct local H I studies. At the distance of Virgo, current radio instruments have the resolution to probe scales of ∼500 pc and the sensitivity to study dwarf galaxies, which are the most fragile systems given their shallow gravitational potential wells, making Virgo a unique laboratory to study galaxy evolution and AGN feedback in a rich environment. In this work, we present some preliminary results including the highest resolution images of the radio emission surrounding M 87 ever captured that show that the lobes are filled with filamentary structures. The combination of the presented radio surveys with state-of-the-art optical (NGVS, VESTIGE), UV (GUViCS), and X-ray (eROSITA) surveys will massively increase the scientific output from the studies of the Virgo cluster, making the ViCTORIA Project’s legacy value outstanding.
Key words: surveys / galaxies: clusters: individual: Virgo / radio continuum: galaxies / radio lines: galaxies / radio lines: general
© The Authors 2025
 Open Access article, published by EDP Sciences, under the terms of the Creative Commons Attribution License (https://creativecommons.org/licenses/by/4.0), which permits unrestricted use, distribution, and reproduction in any medium, provided the original work is properly cited.
This article is published in open access under the Subscribe to Open model. Subscribe to A&A to support open access publication.
1. Introduction
Being the closest rich cluster of galaxies (16.5 Mpc; Mei et al. 2007; Cantiello et al. 2018), Virgo is an excellent laboratory to study environment-driven galaxy evolution, AGN feedback, galaxy-cluster formation, and dynamics. At the centre of the cluster lies the bright radio galaxy M 87 (Virgo A, NGC 4486; e.g., Owen et al. 2000; De Gasperin et al. 2012). Virgo is closer than any other similarly massive cluster such as Hydra, Centaurus, and Abell 3558. Conversely, compared to other galaxy clusters at similar distance such as Fornax, Virgo has a halo mass about ten times larger, with estimates of the virial mass in the range of Mvir ≈ 1.05 − 4.2 × 10¹⁴ M⊙ (McLaughlin 1999; Urban et al. 2011; Simionescu et al. 2017; Boselli et al. 2022; McCall et al. 2024). Virgo is the dominant concentration of mass in the local Universe and by convention is at the centre of the Local Supercluster (Klypin et al. 2003). The Virgo cluster is still in the formation process and dynamically young, with substructures visible both in the X-rays and in the galaxy distribution, such as interacting groups associated with the massive ellipticals M 49, M 60, and M 86 (Böhringer et al. 1994; Boselli et al. 2014). This is further confirmed by the high fraction of spiral galaxies (Boselli et al. 2014), the significant deviation from spherical symmetry (Binggeli et al. 1987), and the properties of the intracluster stars (Aguerri et al. 2005; Arnaboldi 2005).
In systems such as the Virgo cluster, the environment plays a major role in driving galaxy evolution. In fact, rich clusters of galaxies are predominantly populated by quiescent early-type galaxies, with a few star forming systems generally characterised by a low gas content and a reduced star formation activity (e.g. Dressler 1980; Boselli & Gavazzi 2006). Various mechanisms have been proposed to explain this different evolution (e.g. Boselli & Gavazzi 2006) from gravitational perturbations with other cluster members (harassment; Moore et al. 1998) to the hydrodynamic interaction of galaxies with the intracluster medium (ICM; ram pressure Gunn & Gott 1972; Boselli et al. 2022; starvation Larson et al. 1980).
Furthermore, in such systems, the brightest cluster galaxies (BCGs), as well as other cluster members, may host powerful nuclear sources able to transfer mechanical energy to the surrounding ICM and modify its properties such as density and temperature, thus affecting the evolution of the entire cluster and its member galaxies (Fabian 2012). Although all these mechanisms have been widely studied over the last 20 years, their duty cycle and the effects on galaxy evolution are still hotly debated. The main reason is that they involve complex physical processes acting on different scales, from giant molecular clouds and H II regions where star formation takes place (∼50 pc) to the whole cluster (∼1 Mpc). They also involve all gas phases, from the cold atomic and molecular hydrogen, to the ionised and hot gas, implying the need for high-quality multi-wavelength data covering a variety of environments.
Although it is an obvious target for large-scale radio surveys, the Virgo cluster has never been mapped with high-resolution, high-sensitivity blind radio surveys. The reason is twofold: firstly, the cluster angular size is large, with r200 being about 5 38 (1.55 Mpc; Boselli et al. 2023a)1, making surveys demanding in terms of observing time, especially at radio frequencies above 1 GHz; secondly, at the centre of the cluster lies M 87, one of the brightest radio sources on the sky, whose radio emission reaches a flux density of 274 Jy at 1 GHz and 1700 Jy at 100 MHz, lowering the sensitivity of nearby regions because of dynamic range limitations. The most sensitive wide-area surveys that also cover the Virgo field, the TGSS ADR1 (TIFR GMRT Sky Survey – Alternative Data Release 1; Intema et al. 2017), the NVSS (1.4 GHz NRAO VLA Sky Survey; Condon et al. 1998), and the Rapid ASKAP Continuum Survey (RACS) -low (McConnell et al. 2020) and -mid (Duchesne et al. 2023) are all subject to severe imaging and calibration artefacts in the vicinity of M 87. Thanks to the use of two novel radio interferometers, the Low Frequency Array (LOFAR; van Haarlem et al. 2013) and MeerKAT (Jonas 2016), combined with advanced calibration and imaging techniques, we can complete a large-scale blind radio survey of the Virgo cluster with strongly improved image fidelity. With the Virgo Cluster multi-Telescope Observations in Radio of Interacting galaxies and AGN (ViCTORIA) project, we will deliver three blind radio surveys of the Virgo cluster spanning the frequency range from 42 to 1712 MHz and covering out to r200. These radio images of the Virgo cluster region will be 60 times deeper than existing data (see Fig. 1), in full polarisation, and they will include a blind H I survey aimed at mapping seven times more galaxies than previous experiments and without selection biases. The combination with state-of-the-art optical (NGVS, VESTIGE; Ferrarese et al. 2012; Boselli et al. 2018a), UV (GUViCS; Boselli et al. 2011), and X-ray (eROSITA; McCall et al. 2024) surveys will massively increase the scientific potential of this dataset, making its legacy value outstanding.
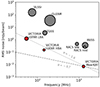 |
Fig. 1. Frequency – sensitivity plot comparing large radio surveys covering the Virgo cluster. The size of the markers scales linearly with resolution from 7″ of ViCTORIA LOFAR HBA to 150″ of GLEAM. The sensitivity is derived from the Virgo region. References: GLEAM (GaLactic and Extragalactic All-sky Murchison Widefield Array survey; Hurley-Walker et al. 2017), TGSS ADR1 (TIFR GMRT Sky Survey – Alternative Data Release 1; Intema et al. 2017); VLSSr (VLA Low-frequency Sky Survey redux; Lane et al. 2014); NVSS (1.4 GHz NRAO VLA Sky Survey; Condon et al. 1998); RACS (Rapid ASKAP Continuum Survey) -low (McConnell et al. 2020) and -mid (Duchesne et al. 2023). |
Throughout this paper, we assume a flat ΛCDM cosmology with Ωm = 0.3 and H0 = 70 km s−1 Mpc−1. At the distance of M 87, for which we adopt a value of 16.5 ± 0.1 (random) ±1.1 (systematic) Mpc (Mei et al. 2007; see also Cantiello et al. 2018, 2024), one arcsecond corresponds to 80 pc. This paper is arranged as follows. In Sect. 2, we present the observations that were or will be released under the project’s umbrella, as well as an overview of the other blind surveys that covered the Virgo cluster at complementary wavelengths. In Sect. 3, we present comparisons with current surveys as well as the highest resolution images of Virgo A (M 87) to date at the frequencies of 54, 144, and 1284 MHz. In Sect. 4 we outline the science cases that are driving the project, and we conclude in Sect. 5.
2. Strategy and observations
The ViCTORIA project consists of three radio surveys that span the 42–1712 MHz frequency range. The surveys are carried out using the LOFAR Low Band Antenna (LBA) and High Band Antenna (HBA) systems, and MeerKAT data were taken with the L-band receivers. Basic data on the surveys are summarised in Table 1. The coverage of the three surveys is visible in Fig. 2, and the joint area is about 99 deg2.
Main properties of the set of surveys that are part of the ViCTORIA Project.
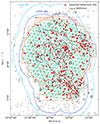 |
Fig. 2. Coverage of ViCTORIA project surveys. In green are the pointings at mid-frequency FWHM of the MeerKAT Virgo Survey designed to fill the orange region covered by NGVS in optical and VESTIGE in H α. In light and dark blue are the coverages of LOFAR LBA and HBA, respectively (mid-frequency FWHM). The red dashed line is the estimated r200. The contours trace the X-ray emission from ROSAT (Böhringer et al. 1994), grey dots are VCC galaxies with recessional velocity ≤ 3000 km s−1, and red dots mark cluster galaxies that we expect to detect based on their H α-brightness. |
2.1. ViCTORIA radio surveys
Here, we describe the observing strategies and preliminary results of the ViCTORIA surveys in more detail.
2.1.1. The LOFAR LBA Virgo Cluster Survey
The survey covers 166 deg2 and encompasses the entire Virgo cluster to more than r200. The survey footprint (see Fig. 2) is composed of nine telescope pointings, with one central pointing aligned with M 87 and eight others covering the outer regions of the cluster. The survey area is elongated towards the south, following the distribution of the ICM and cluster galaxies. The data were collected in two rounds of observations, the first during 2022 and the second in 2023, which finished in early 2024. The total observation time is 60 h, and observations are taken exploiting LOFAR’s multi-beam capability with four parallel beams in the 42–66 MHz frequency range. One beam is always pointed on the calibrator source 3C 295, and the other three observe the selected Virgo Cluster fields. Fields that are observed simultaneously were chosen to minimize the overlap and, hence, the amount of correlated noise. The resulting effective exposure is 36 h for the M 87 field and 18 h for each of the flanking fields.
The presence of the extremely bright (S54 MHz = 2.6 kJy), extended (15′), and morphologically complex radio source M 87 presents a challenge for the data reduction of these observations. Further severe difficulties arise due to the low declination of the field (∼10°), which increases the field of view (FoV) and the projected ionospheric electron density since observations are taken at rather low elevations of 25° −50°. Both of these effects increase the direction-dependent variation of the ionospheric corruptions across the FoV (see De Gasperin et al. 2018).
For M 87 itself, a high-fidelity image at 54 MHz was obtained previously (De Gasperin et al. 2020a). For the calibration of interferometric LOFAR LBA observations, the standard calibration procedures are available in the Library for Low-Frequencies (LiLF2; De Gasperin et al. 2019, 2020b, 2021). To address the additional complications of the Virgo field, a ‘peeling’ strategy to subtract M 87 from the visibility data prior to the direction-dependent calibration will be employed. We followed a similar procedure for the calibration of the LOFAR HBA Virgo Cluster Survey (see Edler et al. 2023 and the following paragraph).
We simulated the expected quasi-thermal noise level of the full mosaic based on the source-equivalent flux densities provided in van Haarlem et al. (2013), taking into account the pointing overlap and sensitivity loss due to the declination and primary beam attenuation. The median quasi-thermal noise level across the full LBA survey area is ≈2.2 mJy beam−1, and ≈1.7 mJy beam−1 for the sky area that is common among the LBA, HBA, and MeerKAT surveys. The resolution of the final mosaics will be approximately 25″ × 15″.
2.1.2. The LOFAR HBA Virgo Cluster Survey
The LOFAR HBA Virgo Cluster Survey (Edler et al. 2023) covers a 132 deg2 area of the Virgo cluster. The pointing scheme follows the same nine fields as the LBA survey, except that each observation has a smaller FoV due to the different station layout and observing frequency. The covered region extends out to r200. The total observation time of 64 h was collected between March 18 2019 and April 2 2019. Two parallel target beams were used, one on M 87 and the other cycling the rest of the fields, in the frequency range from 120 − 168 MHz. The observations were carried out in blocks of 8 h each, yielding an effective exposure of 64 h for the field containing M 87 and 8 h for the eight outer fields. At the beginning and end of each block, a calibrator source (either 3C 196 or 3C 295) was observed for 10 min. This observational setup is identical to the observations of the LOFAR Two-metre Sky Survey (LoTSS; Shimwell et al. 2019, 2022). However, due to the presence of M 87, an adjusted calibration strategy was necessary. After deriving the corrections for the instrumental systematic effects in the calibrator observation and applying them to the target data set, a specialized peeling step was carried out to take care of M 87. In this step, the observations were phase-shifted towards M 87 and averaged in time and frequency. Afterwards, we solved against a high-quality source model of M 87, taking into account the direction-dependent variation of the primary beam across M 87. In this step, we derived scalar phases on 16 s time intervals and full-Jones matrices on 256 s time intervals. These solutions were used to subtract M 87 from the full-resolution data set, which was then phase-shifted back to the original phase centre. Subsequently, ddf-pipeline (Tasse et al. 2021) was used for the full direction-dependent calibration of the observation.
These steps were repeated for each target field, and the resulting images were mosaicked. The detailed description of the calibration, survey properties, and data products of the survey can be found in Edler et al. (2023). In the final survey mosaic, 112 Virgo cluster member galaxies were detected at a significance level of > 4σ. The catalogue and image data of the LOFAR HBA Virgo Cluster survey are available at the CDS3 as well as on the LOFAR Surveys Key Science Project website4.
Mosaics were created at three different resolutions: 9″ × 5″ (high), 20″ (low) and 1′ (very low). At high resolution, which is slightly lower than the one of LoTSS due to the low declination of the Virgo cluster, the median noise level is σrms = 140 μJy beam−1, while for the full area, σrms = 280 μJy beam−1 is reached.
2.1.3. The MeerKAT Virgo Cluster Survey
The MeerKAT Virgo Cluster Survey covers an area of 112 deg2, extending to about r200 and following the footprint of the optical surveys VESTIGE and NGVS (see Sect. 2.3). The survey was completed in two different cycles, the first observed in 2023 covering the inner region up to about 1 Mpc in radius, and the second observed in 2024 expanding to the VESTIGE/NGVS footprints. The total observing time is 230 h on target and 287 h including overheads. Each observing run included observations on the bandpass calibrator (J1939-6342) and the polarisation calibrator (3C 286). The target observations were interleaved with ten-minute-long observations of a gain calibrator (J1150-0023). The total number of pointings is 320, and they are organised in a hexagonal grid with a spacing of 0.58° yielding a full Nyquist-sampling ( ) at the H I frequency (1420 MHz) and closer than
  at the lowest end of the band. Each pointing has a total of 43–45 minutes of effective integration time spanning a 4.5 h observing run.
Dynamic range limitation due to the presence of the bright source M 87 has been proven to be under control thanks to a pilot experiment that covered five fields moving away from the bright source (see Fig. 3). The observing strategy of the pilot pointings is equal to the one used for the rest of the survey. Thanks to the pilot experiment, we were able to derive an ad hoc calibration strategy to properly remove (peel) the emission of M 87 from the data for the affected fields. With the pilot we showed that only the closer pointings (< 1°) have an increased noise level.
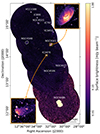 |
Fig. 3. MeerKAT L-band data mosaic of five pointings covering M 87 and moving towards the north-east. These fields were used as a pilot experiment to derive a good calibration strategy. The dynamic range limitation due to the presence of the bright radio emission from M 87 is evident in the increased rms noise in the pointings where the source is within the primary beam. |
The expected noise and resolution, confirmed by the pilot experiment, of the survey is 7 μJy beam−1 at a resolution of 7.6″ (Briggs: −0.5). The line noise is 0.204 μJy beam−1 per 25 km s−1 channel at a 30″ resolution.
2.2. Main deliverables
Using the aforementioned data, the ViCTORIA project is aimed at producing the following deliverables:
-
Three continuum surveys at 42–66 MHz, 120–168 MHz, and 856–1712 MHz, reaching the sensitivity levels of 1700, 150, and 7 μJy beam−1, respectively. No other large survey of the Virgo cluster has been attempted at these frequencies, so the improvement compared to NVSS at 1.4 GHz will be of a factor of 60 in depth and six in resolution (see Fig. 1). Based on VESTIGE and the H α-radio correlation (Boselli et al. 2015), the high-frequency survey should detect ∼330 galaxies (vs. 79 known before) entering – for the first time – well into the parameter space of dwarf systems. The data will also enable the detection of low-surface-brightness features associated with the stripped material accessible only through a blind survey, and reach beyond rvir of a M200 ≥ 1014 M⊙ cluster at this depth and spatial resolution for the first time. Specifically, the large coverage of the ViCTORIA surveys will enable the detection of those galaxies entering into the cluster for the first time; here, ram pressure is likely to be an efficient mechanism for their transformation (Boselli et al. 2022, 2023a).
-
A blindHIsurvey with an N(H I) sensitivity level (3σ over a line width of 25 km s−1) from ∼2 × 1018 cm−2 at ∼2′ resolution (∼10 kpc at the distance of Virgo) to ∼2 × 1020 cm−2 at ∼10″ resolution (∼0.8 kpc; see Table 2). This combination of resolutions and column densities matches the predictions of numerical hydrodynamical simulations for the density of the gas in the tails of stripped material (Tonnesen & Bryan 2010) that are in close agreement with other observations Chung et al. (2007). At a high resolution, similar quality data are only available for 53 massive galaxies (VIVA; Chung et al. 2009). The full MeerKAT survey will bring the H I detections of resolved galaxies to ∼370, extending the dynamic range to dwarf systems, reaching MH I = 2.0 × 10⁶ M⊙ (3σ over a 100 km s−1 line width).
-
A blind polarisation survey aimed at detecting the magnetic field structure in galaxies, tails, and AGN-driven emission. The data will allow the identification of an estimated 2000 objects through RM synthesis (MIGHTEE collaboration, priv. comm.).
-
A resolved spectral index estimation between 144 MHz (LOFAR HBA) and 1284 MHz (MeerKAT) of all radio sources with S144 MHz > 450 μJy beam−1, at an angular scale of 7″ (560 pc), and down to spectral index α = −1.4. Including the data at 54 MHz (LOFAR LBA), the study of spectral curvature will be possible at a resolution of 17″ (1.4 kpc).
ViCTORIA H I mosaic cubes.
2.3. Complementary surveys
The favourable declination of Virgo (∼12°), accessible from both hemispheres, enabled several high-profile multi-λ surveys. The whole cluster was observed in the 1980s with the du Pont 2.5 m telescope at Las Campanas by Sandage, Tammann, and Binggeli, who made the first systematic identification of the Virgo cluster members, the Virgo Cluster Catalogue (VCC; Binggeli 1985), and several targeted studies of the statistical properties of its galaxies (e.g. Sandage et al. 1985). Since this seminal work, which was still based on photographic plates, different blind surveys covered the whole cluster. In the optical band, after the SDSS observations of the cluster (e.g. Lisker et al. 2006a,b, 2007) and of its surrounding regions leading to the Extended Virgo Cluster Catalogue (EVCC; Kim et al. 2015), the cluster was the target of the Next Generation Virgo cluster Survey (NGVS; Ferrarese et al. 2012) undertaken with MegaCam at the Canada French Hawaii Telescope (CFHT). The very deep u, g, i, z images, which covered 104 deg2 corresponding to ≃r200, allowed the identification of ≃3700 members (Ferrarese et al. 2020) and the study of their structural properties down to the dwarf galaxy population (Mstar ∼ 106 M⊙), including those of peculiar objects such as ultra-diffuse galaxies (UDGs; Lim et al. 2020; Junais et al. 2022) and ultra-compact galaxies (UCDs; Liu et al. 2020). The cluster was observed up to R ≃ 2r200 in the FUV (λ = 1539 Å) and NUV (λ = 2316 Å) bands during the GALEX Ultraviolet Virgo Cluster Survey (GUViCS; Boselli et al. 2011). At these wavelengths, the emission of galaxies is dominated by the young stellar population (e.g. Kennicutt 1998; Boselli et al. 2009). The cluster was also covered by the Virgo Environmental Survey Tracing Ionised Gas Emission (VESTIGE; Boselli et al. 2018a), a blind narrowband Hα imaging survey carried out with MegaCam at the CFHT. This survey allowed the detection of all the star forming galaxies of the cluster (384 objects) and the estimation of their present day star formation activity (Boselli et al. 2023a,b). The GALEX and the VESTIGE data were thus fundamental for reconstructing the star formation history of all cluster members and finally studying the quenching process occurring in dense environments with unprecedented accuracy (e.g. Boselli et al. 2015, 2023c). The dust emission of the cluster galaxies was secured thanks to the all-sky WISE survey (Wright et al. 2010) and the Herschel Virgo cluster Survey (HeViCS; Davies et al. 2010; Auld et al. 2013), a blind survey covering the central 64 deg2 of the cluster at 100, 160, 250, 350, and 500 μm. Dedicated X-ray observations such as those done with Rosat (Böhringer et al. 1994), XMM-Newton (Urban et al. 2011), Suzaku (Simionescu et al. 2017), and eROSITA (McCall et al. 2024) were crucial for deriving the main properties of the intracluster medium (ICM; hot gas distribution, density, and temperature), and compare them to those of different cluster members to quantify the perturbations induced by the surrounding environment on galaxy evolution (Vollmer et al. 2001; Gavazzi et al. 2013; Boselli et al. 2014). In the radio domain, the cluster was covered by several wide area radio-continuum surveys (see Sect. 3.2) and in the H I line at 21 cm by HIPASS (Meyer et al. 2004) and by ALFALFA (Giovanelli et al. 2005).
Thanks to its proximity, many Virgo cluster galaxies were and are still the targets of dedicated observations at almost all wavelengths. Worth mentioning are the ACS Virgo Cluster Survey of 100 early-type galaxies with the Hubble telescope (Cote et al. 2004), VLA H I (VIVA; Chung et al. 2009), Arecibo H I (Gavazzi et al. 2005), ALMA CO (VERTICO; Brown et al. 2021), and VLT/MUSE IFU spectroscopy (MAUVE, VLT Large program, PI Cortese) observations of 50 late-type galaxies or pointed observations in X-ray with Einstein (Fabbiano et al. 1992; Shapley et al. 2001) and Chandra (Gallo et al. 2008; Soria et al. 2022), and mid- and far-IR with ISO (Leech et al. 1999; Tuffs et al. 2002; Boselli et al. 2003), Spitzer (Bendo et al. 2012), and Herschel (Ciesla et al. 2012; Cortese et al. 2014). Pointed observations of individual galaxies are also available in the radio continuum at 4.8, 8.6, and 10.55 GHz (Niklas et al. 1995; Vollmer et al. 2004; Capetti et al. 2009). All cluster members with a B-band magnitude brighter than mB ≲ 16 AB mag have been observed in near-infrared bands (Boselli et al. 1997; McDonald et al. 2011; Muñoz et al. 2014; Janz et al. 2014) and the star forming one with pointed H α narrowband imaging (Koopmann et al. 2001; Gavazzi et al. 2002, 2013).
3. Comparisons with current surveys
3.1. Comparison with H I surveys
The VIVA survey (Chung et al. 2009) provided pointed observations of 53 galaxies in the Virgo cluster, most of which are located within the footprint of the ViCTORIA observations. The typical 3σ sensitivity level of the VIVA data is N(H I) ∼ 6 − 8 × 1019 cm−2 at an angular resolution of ∼15″and assuming a line width of 25 km s−1. We can thus compare the two different sets of data. Figure 4 shows the galaxy NGC 4424, which is located in the southern portion of the Virgo cluster. This galaxy exhibits a perturbed H I morphology, with an extended low-column-density tail in the south-east direction, this is indicative of recent interactions. The figure shows that with ViCTORIA we recover all the emission detected by VIVA at a comparable resolution. However, we also detect significantly more diffuse H I thanks to the much better H I gas-column-density sensitivity reached at a lower resolution. NGC 4424 was also observed using the Karoo Array Telescope (KAT-7), a precursor of MeerKAT, with 30 h of on-source integration, and with the Westerbork Synthesis Radio Telescope (WSRT) using APERITIF (12 h on-source; Sorgho et al. 2017). The extended tail was detected in the combined dataset with properties of (N(H I) ∼ 5 × 1018 cm−2, 3σ at an angular resolution of ∼174″ × 30″, and assuming a line width of 16.5 km s−1) similar to those gathered in the MeerKAT data (see Fig. 5 in Sorgho et al. 2017). ViCTORIA is thus perfectly suited to searching for extended, low H I gas column densities such as those produced during the interaction of galaxies with their surrounding environment, while still enabling the study of the H I morphology and kinematics at a high resolution.
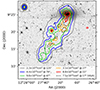 |
Fig. 4. H I gas distribution of perturbed galaxy NGC 4424 seen by ViCTORIA. For each resolution, we show the lowest reliable contour (3σ over a line width of 25 km s−1). The contours are overlaid on an r-band image downloaded from the Legacy Survey database. The contour levels and resolutions are listed in the legend at the bottom, and the resolutions are shown in the top left corner. For comparison, we also show the lowest reliable H I contour from the VIVA survey (Chung et al. 2009), defined for consistency at a 3σ level over a line width of 25 km s−1. |
The ALFALFA survey (Giovanelli et al. 2005) covered the whole Virgo cluster region with the Arecibo radio telescope, detecting, within the ViCTORIA footprint, 267 galaxies (Haynes et al. 2018) and several H I clouds not associated with any stellar counterpart (Kent et al. 2007, 2009)5. The typical ALFALFA sensitivity level is N(H I) = 2 × 1018 cm−2 for H I filling the 3.5′ beam and assuming a line width of 25 km s−1 with channels of 10 km s−1 (see Sect. 6 of Giovanelli et al. 2005). This low H I column density can be reached by the ViCTORIA survey, as shown in Fig. 5 for the complex of clouds originally discovered by Kent et al. (2009) and later studied by Jones et al. (2024). All of the five clouds discovered by ALFALFA are detected in the MeerKAT data. Mapped at higher angular resolution (∼125″ vs. ∼210″), they show a different morphology . The higher angular resolution of ViCTORIA compared to ALFALFA thus enables a more detailed analysis of their morphology and kinematics.
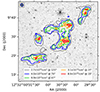 |
Fig. 5. H I clouds detected during ALFALFA survey by Kent et al. (2009) as seen by ViCTORIA. For each resolution, we show the lowest reliable contour (3σ over a line width of 25 km s−1). The contours are overlaid on an r-band image downloaded from the Legacy Survey database. The contour levels and resolutions are listed in the legend at the bottom, and the resolutions are shown in the top left corner. |
3.2. Comparison with blind radio-continuum surveys
Blind radio surveys of the Virgo cluster are complicated to perform mostly because of the wide apparent size of the cluster that, including the substructures, covers more than 100 deg2 of the sky and because of the presence of the radio source Virgo A (M 87). The source is among the brightest in the northern sky, reaching a flux density of ∼200 Jy at 1400 MHz and ∼1300 Jy at 140 MHz. The presence of Virgo A severely limited wide-area blind surveys in the region. For instance, NVSS, RACS low, TGSS, and VLSSr all have a local rms noise many times higher than the nominal one and a reduced fidelity due to the presence of many artefacts coming from an improper calibration and deconvolution of M 87. Having an ad hoc strategy to subtract the effect of M 87 during calibration, the ViCTORIA surveys can achieve higher levels of sensitivity and fidelity (see e.g. Fig. 6).
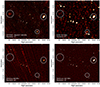 |
Fig. 6. Comparison of various surveys in L band: ViCTORIA MeerKAT (from the pilot fields shown in Fig. 3), NVSS, and RACS low and mid. The circles show the locations of NGC 4548, NGC 4501 and IC 3476 (from top left to bottom right). |
4. Science cases and preliminary results
4.1. Galaxy evolution
The Virgo cluster is an ideal laboratory for studying the effects of the environment on galaxy evolution. Located only 16.5 Mpc away, it allows us to study all galaxy populations down to the dwarf regime with unprecedented sensitivity and at an unprecedented angular resolution. This is crucial for understanding the effects of the different perturbing mechanisms (gravitational and hydrodynamical) on the different gas components and on the star formation process down to the scale of individual giant molecular clouds and H II regions. Dwarf systems are of fundamental importance since they have a shallow gravitational potential well; they are thus the most easily perturbed objects in any kind of interaction.
HI gas. The MeerKAT data at 21 cm provide us with a complete, H I-selected sample of galaxies in a rich cluster. These data are thus perfectly suited to reconstructing the H I mass function and comparing it with those derived in other environments such as clusters, groups, and the fields that recent (Zwaan et al. 1997, 2005; Rosenberg & Schneider 2002; Martin et al. 2010; Moorman et al. 2014; Said et al. 2019), ongoing, and future surveys (e.g. WALLABY or the MeerKAT Fornax Survey; Koribalski et al. 2020; Serra et al. 2023) will soon provide. The complete census of the H I content of gas-rich systems down to MH I ≃ 2 × 10⁶ M⊙ on a statistically significant sample (more than 300 objects) allows us to reconstruct the main H I scaling relations of galaxies down to the dwarf regime and compare them to those derived for field objects (e.g. Catinella et al. 2018; Saintonge & Catinella 2022) to quantify the impact of the environment on the atomic gas content of cluster systems (e.g. Cortese et al. 2011).
Distributed on a thin (1–5 kpc) and low-column-density N(H I) ≃ 1019 − 1020 cm−2) disc, H I gas is a baryonic component that is less bound to the gravitational potential well of galaxies. For this reason, it is easily removed in any kind of interaction. The presence of tails of cold H I gas are thus ideal tracers of galaxies undergoing a perturbation (e.g. Chung et al. 2007). They can also be used to identify the dominant perturbing mechanism, which is gravitational when associated with an asymmetry in the old stellar component and hydrodynamic when only on the gaseous component (Boselli et al. 2022, 2023b). H I-resolved data are fundamental in the study of individual objects when combined with multi-frequency data and compared with tuned models and simulations (e.g. Vollmer et al. 2008, 2009, 2012, 2018, 2021; Boselli et al. 2018b,c). As an example, a pilot study using H I data gathered at the beginning of this project allowed us to identify a galaxy undergoing a perturbation (NGC 4523), recognise ram pressure stripping as the dominant mechanism, and study the effects of the perturbation on the kinematics of the gas in detail (Boselli et al. 2023a). Using all data of the Virgo MeerKAT survey, we reach an  better sensitivity level than in the pilot study, and Fig. 7 shows the updated H I image of that galaxy. The data provided by the full survey of the cluster will enable the extension of this kind of analysis to several tens of objects and thus give us a more representative view of the complex interaction between galaxies and their surrounding environment.
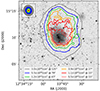 |
Fig. 7. H I gas distribution of NGC 4523. For each resolution, we show the lowest reliable contour (3σ over a line width of 25 km s−1). The contours are overlaid on an r-band image downloaded from the Legacy Survey database. The contour levels and resolutions are listed in the legend at the bottom, and the resolutions are shown in the top left corner. At the highest resolution of 15″, we also show an additional contour at a 5× higher column density than the lowest reliable contour. These H I images reach column densities a factor of |

Combined with data available for the other gas phases (cold molecular, ionised, hot), the H I data will be crucial for understanding the fate of the stripped gas within the hot ICM. Several observations and simulations suggests that the gas is stripped from the galaxy disc mainly in its cold atomic phase. Once mixed with the hot ICM, it warms up after energy transfer via shocks, heat conduction, magneto-hdyrdodynamic waves, becoming first ionised than hot gas (e.g. Tonnesen & Bryan 2010, 2012; Tonnesen et al. 2011; Fossati et al. 2016; Boselli et al. 2016, 2021, 2022). Whenever the gas density in the tail is sufficiently high, the gas can collapse to form giant molecular clouds and then new stars. Part of the gas, the one located not far from the galaxy, can fall back on the disc once the galaxy reaches the cluster outskirts (Vollmer et al. 2001). The remaining gas is definitively stripped, and after mixing with the surrounding medium, it contributes to the pollution of the ICM (Longobardi et al. 2020a,b). The 21 cm observations will thus be crucial to identify tails of stripped gas as those already observed in seven galaxies in the VIVA survey (Chung et al. 2007) or in NGC 4523 where the transformation of the stripped material can be finally studied with unprecedented statistics. The data can also be used to search for free floating H I clouds not associated to any stellar disc, generally called almost dark galaxies, as those detected by the ALFALFA survey (Haynes et al. 2007; Kent et al. 2007, 2009; Koopmann et al. 2008; Minchin et al. 2007, 2019), which might be residual of past interactions (see Fig. 5).
Finally, the kinematic information that the H I data cubes will provide for the extended tails of stripped gas can be used to reconstruct the 3D-orbital parameters of galaxies within the Virgo cluster, as done with NGC 4569 by Sarpa et al. (in prep.).
Continuum. The sensitivity of the LOFAR and MeerKAT surveys will allow us to measure the radio-continuum luminosity function of the cluster at three different frequencies, significantly improving the one now available at 20 cm and based on the shallow NVSS data (Gavazzi & Boselli 1999a). As for the H I mass function, the radio continuum luminosity functions will be compared to those that all sky surveys will soon provide for galaxies in different density regions from the general field, voids, groups, and rich clusters of galaxies (e.g. Norris et al. 2021; Shimwell et al. 2022). The same luminosity functions will be references for high-redshift studies. The radio-continuum data can be used to trace the mean statistical properties of galaxies in a rich nearby cluster (scaling relations) and compare them to those of similar galaxies in the field to quantify the impact of the environment on the radio emission down to the dwarf population. It will be possible to check whether the radio emission of cluster galaxies is increased with respect to those of field objects on global and local scales, as first noticed at 1400 MHz by Gavazzi et al. (1991) in the Coma cluster and later confirmed in the Virgo cluster at other frequencies (Niklas et al. 1995; Gavazzi & Boselli 1999a; Murphy et al. 2009). In particular, the different radio polarisation properties will be used to measure the ordered magnetic field over the disc of the detected galaxies and thus test whether the claimed compression of B is at the origin of the observed increased radio emission of cluster galaxies (Gavazzi et al. 1991; Völk & Xu 1994; Gavazzi & Boselli 1999a,b; Edler et al. 2024).
The discovery of head-tailed radio galaxies in rich clusters was the first observational evidence of ram pressure exerted by the external medium on galaxies moving at high velocity within it (e.g. Gunn & Gott 1972). Since then, extended radio-continuum tails have been observed in several cluster galaxies at different radio frequencies (e.g. Gavazzi et al. 1995; Roberts et al. 2021a,b, 2022) and are becoming efficient tools to identify objects undergoing an external perturbation. Measuring the magnetic field in the stripped material (Vollmer et al. 2021; Ignesti et al. 2022), here made possible by polarisation studies, is important to understand the star formation process in this extreme environment. Indeed, several tuned magneto-hydrodynamic simulations suggest that in the presence of magnetic-field matter remains confined, meaning relatively high gas column densities are necessary for the collapse of gas into giant molecular clouds where stars are formed (Tonnesen & Stone 2014; Ruszkowski et al. 2014).
The multi-frequency radio-continuum data, which will be available for several hundreds objects, will be combined with those already gathered at other frequencies (Hα, UV, far-IR) to study the star formation process on different timescales (e.g. Boselli et al. 2015; Vollmer et al. 2022; Edler et al. 2024). Typical timescales will also be inferred by combining the three ViCTORIA datasets and measuring the steepening of the radio spectral slope in the tails of stripped material (Vollmer et al. 2004, 2021; Chen et al. 2020; Ignesti et al. 2023; Roberts et al. 2024). Combined with other temporal tracers, such as the ageing of the stellar populations, these data will be crucial to measuring the typical timescale for gas stripping and quenching of the star formation process; these are other important parameters necessary for the identification of the dominant perturbing mechanism in rich environments (e.g. Boselli et al. 2022).
4.2. AGNs and M87
Usually, only a few AGNs are detected in each galaxy cluster. Thanks to the combination of observational depth and cluster distance, we will collect the first significant statistics of active nuclei in a galaxy cluster to compare their nuclear (instantaneous) and extended (integrated) radio emission with the galaxy properties and location across the cluster. AGNs will also be detected in background clusters and groups. Based on nuclear spectroscopy (Cattorini et al. 2023) and X-ray observations (Gallo et al. 2010; Hou et al. 2024), the known number of AGNs in the survey footprint is 81. Initial results are presented in Spasic et al. (2024).
At the centre of the Virgo cluster resides the notorious M 87 galaxy, whose radio emission is also called Virgo A. At the centre of M 87 resides M 87*, the first supermassive black hole imaged with the Event Horizon Telescope (Event Horizon Telescope Collaboration 2019). Its jets have also been meticulously studied from the formation region (Lu et al. 2023) up to their extension (Owen & Biretta 1999). The source has also been extensively observed in the X-ray (Forman et al. 2007; Million et al. 2010), where Chandra and XMM-Newton revealed, along with hot gas at 2–3 keV, the presence of extended gas filaments at lower temperature and entropy which are closely related to the radio-emitting structures. Two AGN-driven shocks (M ≃ 1.2) have been found at distances of about 3 kpc and 14 kpc, respectively, from the central AGN (Forman et al. 2007; Million et al. 2010). These repeated shocks might have distributed part of the energy necessary to offset the radiative cooling of the ICM. Finally, several bubbles of plasma and cavities excavated by injections of relativistic particles have been detected both in the inner region and in the extended halo (Forman et al. 2007). Bubbles and cavities contain even larger amounts of energy, which can also contribute to gas heating (Churazov & Kaiser 2001; Zhang et al. 2018).
The AGN itself and signs of its interaction with the ICM have also been seen in the radio band (Owen et al. 2000; De Gasperin et al. 2012). The morphology of this radio source cannot be easily classified as FRI/FRII, and it is characterised by a compact and bright inner region that contains the jet, an eastern lobe with a characteristic mushroom shape, and a south-western lobe that bends from the direction of the jet. The central region and the lobes are surrounded by two overlapping spherical halos of low brightness (about 40 kpc across). High-resolution maps and Faraday rotation data of the inner cocoon showed that the magnetic field (and therefore the radio emission) is highly filamentary (Owen et al. 2000). Interestingly, radio filaments twist and wrap around the coldest metal-rich X-ray emitting gas, suggesting a complex interplay between the radio (non-thermal) and the X-ray (thermal) plasmas (Forman et al. 2007).
Images obtained from the ViCTORIA project surveys (see Fig. 8) provide the highest resolution images of the Virgo A extended structure (4″ × 3″ at 144 MHz from LOFAR HBA data (including international stations), but also the images with the highest resolution at 54 MHz (beam: 16″ × 12″) and 1284 MHz (beam: 12″ × 6″) to date. The combination of these data will be exploited to study detailed spectral properties of the source (de Gasperin et al., in prep.). The data show evidence of complex filamentary structures filling up the volume of the lobes. Furthermore, the west plasma flow is now more similar to the famous ear to the east, suggesting that Rayleigh–Taylor instabilities are driving the shapes of both. A filamentary structure joining the two ears, likely due to a stretched or a reconnected magnetic field, also appear well visible below the central cocoon (see Fig. 9). These elongated filaments (or collimated synchrotron threads; CST) connecting distant lobes of radio galaxies were detected in one other case and still have an unclear origin (Ramatsoku et al. 2020).
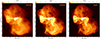 |
Fig. 8. Virgo A (the radio emission associated with M87) as seen by the three ViCTORIA surveys (de Gasperin et al., in prep.). From left to right: LOFAR LBA (54 MHz, beam: 16″ × 12″), LOFAR HBA (144 MHz, beam: 4″ × 3″ including LOFAR international stations), and MeerKAT L band (1284 MHz, beam: 12″ × 6″). The beam size is shown in the bottom left corner of each image. |
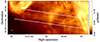 |
Fig. 9. Extract from central panel of Fig. 8, where the collimated synchrotron thread is visible and joins the two ‘ears’. |
4.3. Foreground science
The spectral domain chosen for the 21 cm observations covers a wide range of velocities, from the Milky Way up to z ∼ 0.6. This is a unique dataset in terms of sensitivity and angular resolution used to study the H I gas distribution of the Galaxy at high galactic latitude (b ≥ 70°) on a ≃100 deg2 contiguous field. The H I data can be combined with those already available at other frequencies for this sky region to study the relation between the atomic gas distribution (GALFA, Peek et al. 2011; ALFALFA, Bianchi et al. 2017), the ionised gas distribution (WHAM, Reynolds et al. 1998; VESTIGE, Boselli et al. 2018a), and that of cold dust as traced by far-IR emission (IRAS, Planck, Herschel) or by the scattered light detected in the UV bands during the GUViCS survey (Boissier et al. 2015). The comparison done in Sect. 3.1 clearly indicates that the sensitivity of the H I MeerKAT data is comparable to the one reached by ALFALFA at low angular resolution. It is thus likely that all the diffuse and extended features studied by Bianchi et al. (2017) will be detected in our new set of data. The H I data can also be used to look for high-velocity clouds as those discovered during the GALFA-H I, Saul et al. (2012) and ALFALFA (Adams et al. 2013; Bellazzini et al. 2015) surveys. As discussed in Sect. 3.1, the H I MeerKAT data have not only the sensitivity to detect these features, but also the angular resolution to study their nature in great detail.
Large-scale extended emission of galactic origin can be picked up more easily at lower frequencies, where the interferometers can detect larger patches of emission without resolving them out. Data from the LOFAR HBA Virgo Survey showed that we can detect large stripes of galactic emission crossing the survey footprint (Edler et al. 2023). Based on their location and orientation, the authors suggest an association with the North Polar Spur (Loop I), a Galactic spherical structure that can be either local (d ∼ 100 pc) or originating from the Galactic centre.
4.4. Background science
Galaxies belonging to large scale structures will be detected during the ViCTORIA survey. The most famous of these structures, the Great Wall (Geller & Huchra 1989), falls within the footprint of the survey. The Great Wall has a filamentary structure typical of superclusters, extending over hundreds of degrees on the sky at a fairly common distance of ∼80 − 140 Mpc. Similar structures are also present at further distances. At the sensitivity level of the survey (noise level of 0.6 mJy beam−1 per 5.5 km s−1 channel), the 5σMH I detection limit assuming a H I line width of 200 km s−1 for a galaxy at a distance D(Mpc) is MH I = 2.3 × 10⁴ M⊙ × D(Mpc)2. For a typical distance of D ≃ 100 Mpc, we can detect galaxies down to MH I = 2.3 × 10⁸ M⊙. Detections of galaxies in the Great Wall in the background of Virgo have been already reported by Hoffman et al. (1995) and more recently by Haynes et al. (2018). These galaxies will provide a comparison sample of fairly isolated systems to which the Virgo data will be compared with the purpose of understanding the effects of the cluster environment on galaxy evolution.
The sky in the direction of the Virgo cluster region has been covered with deep blind surveys at almost all frequencies (see Sect. 2.3). This region is thus an ideal laboratory in which to study galaxy evolution as a function of cosmic time with a multi-frequency statistical analysis. While not as deep as other well studied fields (e.g. COSMOS, Schinnerer et al. 2007; Smolčić et al. 2017), this region is sufficiently wide (∼100 deg2) to be free from cosmic variance, and thus it is ideally suited for studying the statistical distribution of galaxies (correlation function) and of their properties as a function of local density in different bands thanks to the NGVS photometric redshift catalogue of ∼3 × 10⁷ sources (Raichoor et al. 2014).
4.5. Cluster magnetic field
Following Rudnick & Owen (2014), and considering a 6σ detection threshold, we expect to detect 3677 polarised sources6 from the MeerKAT Virgo Cluster Survey within the cluster region. About 43 should be detectable with the LOFAR HBA Virgo cluster Survey (O’Sullivan et al. 2023). Compared to the L band, RM values extracted from LOFAR HBA data have a higher level of precision. We do not expect to detect a significant number of polarised sources in the LBA survey due to depolarisation. Having 3677 RM measurements will enable the derivation of the magnetic field strength and structure by modelling the RM profile in the cluster (Murgia et al. 2004; Bonafede et al. 2010) or the radial depolarization trend (Osinga et al. 2022). This will be made possible thanks to the complementary X-ray observations, which will be used to derive the thermal electron density profile (McCall et al. 2024). An accurate measure of the strength of the magnetic field is important to understand the origin of the large-scale radio emission and the relevance of this non-thermal component with respect to the thermal component.
5. Conclusions
In this paper, we outline the Virgo Cluster multi-Telescope Observations on Radio of Interacting galaxies and AGNs (ViCTORIA) Project and described its three constituents: 1. The LOFAR LBA Virgo Cluster Survey (42–66 MHz); 2. The LOFAR HBA Virgo Cluster Survey (120–168 MHz); and 3. The MeerKAT Virgo Cluster survey (856–1712 MHz). The data of all three surveys cover out to about r200, including the main sub-clusters. The project will deliver three blind surveys of the Virgo cluster spanning the 42–1712 MHz frequency range, polarisation data in the L band with rotation measure down to 120 MHz, a blind H I survey of the entire region, and a spectral index map of any emission detected in multiple bands.
The project showed its potential with some early results including a detailed study of the complex H I structure in NGC 4523 (Boselli et al. 2023b), the analysis of a sample of 17 ram-pressure-stripped galaxies in the Virgo cluster (Edler et al. 2024), and the study of the AGN emission from a sample of 12 early-type galaxies that included the discovery of large radio-filled cavities in the famous M 49 galaxy (Spasic et al. 2024). In this paper, we show some forthcoming results, presenting the highest resolution maps ever obtained of the radio emission surrounding M 87 in the survey’s three frequency ranges. We show that the whole lobes are filled with resolved filamentary structures, including the second known case of CST linking the two rising lobes.
For consistency with NGVS and VESTIGE we assume throughout this paper r200 = 1.55 Mpc determined using the galaxy distribution; this value is larger than those presented in Boselli et al. (2022) and Simionescu et al. (2017) that are both close to r200 = 1 Mpc and have been derived using X-rays data.
A blue, compact star forming complex has been recently identified by Jones et al. (2024) as the probable stellar counterpart of the cloud complex discovered in Kent et al. (2009).
MIGHTEE early science fields suggests that the number of polarised sources in the area might be underestimated by a factor 2 (Taylor et al. 2024).
Acknowledgments
FdG acknowledge the support of the ERC Consolidator Grant ULU 101086378. The Low Frequency Array, designed and constructed by ASTRON, has facilities in several countries, that are owned by various parties (each with their own funding sources), and that are collectively operated by the International LOFAR Telescope (ILT) foundation under a joint scientific policy. The MeerKAT telescope is operated by the South African Radio Astronomy Observatory, which is a facility of the National Research Foundation, an agency of the Department of Science and Innovation. This research has made use of NASA’s Astrophysics Data System. This research has made use of SAOImage DS9, developed by Smithsonian Astrophysical Observatory.
References
- Adams, E. A. K., Giovanelli, R., & Haynes, M. P. 2013, ApJ, 768, 77 [NASA ADS] [CrossRef] [Google Scholar]
- Aguerri, J. A. L., Gerhard, O. E., Arnaboldi, M., et al. 2005, Astron. J., 129, 2585 [NASA ADS] [CrossRef] [Google Scholar]
- Arnaboldi, M. 2005, AIP Conf. Proc., 804, 301 [NASA ADS] [CrossRef] [Google Scholar]
- Auld, R., Bianchi, S., Smith, M. W., et al. 2013, MNRAS, 428, 1880 [NASA ADS] [CrossRef] [Google Scholar]
- Bellazzini, M., Magrini, L., Mucciarelli, A., et al. 2015, ApJ, 800, L15 [NASA ADS] [CrossRef] [Google Scholar]
- Bendo, G. J., Galliano, F., & Madden, S. C. 2012, MNRAS, 423, 197 [NASA ADS] [CrossRef] [Google Scholar]
- Bianchi, S., Giovanardi, C., Smith, M. W. L., et al. 2017, A&A, 597, A130 [NASA ADS] [CrossRef] [EDP Sciences] [Google Scholar]
- Binggeli, B. 1985, Astron. J., 90, 1681 [NASA ADS] [CrossRef] [Google Scholar]
- Binggeli, B., Tammann, G. A., & Sandage, A. 1987, Astron. J., 94, 251 [NASA ADS] [CrossRef] [Google Scholar]
- Böhringer, H., Briel, U. G., Schwarz, R. A., et al. 1994, Nature, 368, 828 [CrossRef] [Google Scholar]
- Boissier, S., Boselli, A., Voyer, E., et al. 2015, A&A, 579, A29 [NASA ADS] [CrossRef] [EDP Sciences] [Google Scholar]
- Bonafede, A., Feretti, L., Murgia, M., et al. 2010, A&A, 513, A30 [NASA ADS] [CrossRef] [EDP Sciences] [Google Scholar]
- Boselli, A., & Gavazzi, G. 2006, PASP, 118, 517 [Google Scholar]
- Boselli, A., Tuffs, R. J., Gavazzi, G., Hippelein, H., & Pierini, D. 1997, A&AS, 121, 507 [NASA ADS] [CrossRef] [EDP Sciences] [Google Scholar]
- Boselli, A., Sauvage, M., Lequeux, J., Donati, A., & Gavazzi, G. 2003, A&A, 406, 867 [NASA ADS] [CrossRef] [EDP Sciences] [Google Scholar]
- Boselli, A., Boissier, S., Cortese, L., et al. 2009, ApJ, 706, 1527 [Google Scholar]
- Boselli, A., Boissier, S., Heinis, S., et al. 2011, A&A, 528, A107 [NASA ADS] [CrossRef] [EDP Sciences] [Google Scholar]
- Boselli, A., Voyer, E., Boissier, S., et al. 2014, A&A, 570, A69 [NASA ADS] [CrossRef] [EDP Sciences] [Google Scholar]
- Boselli, A., Fossati, M., Gavazzi, G., et al. 2015, A&A, 579, A102 [NASA ADS] [CrossRef] [EDP Sciences] [Google Scholar]
- Boselli, A., Cuillandre, J. C., Fossati, M., et al. 2016, A&A, 587, A68 [NASA ADS] [CrossRef] [EDP Sciences] [Google Scholar]
- Boselli, A., Fossati, M., Ferrarese, L., et al. 2018a, A&A, 614, A56 [NASA ADS] [CrossRef] [EDP Sciences] [Google Scholar]
- Boselli, A., Fossati, M., Cuillandre, J. C., et al. 2018b, A&A, 615, A114 [NASA ADS] [CrossRef] [EDP Sciences] [Google Scholar]
- Boselli, A., Fossati, M., Consolandi, G., et al. 2018c, A&A, 620, A164 [NASA ADS] [CrossRef] [EDP Sciences] [Google Scholar]
- Boselli, A., Lupi, A., Epinat, B., et al. 2021, A&A, 646, A139 [NASA ADS] [CrossRef] [EDP Sciences] [Google Scholar]
- Boselli, A., Fossati, M., & Sun, M. 2022, Astron. Astrophys. Rev., 30, 3 [NASA ADS] [CrossRef] [Google Scholar]
- Boselli, A., Fossati, M., Côté, P., et al. 2023a, A&A, 675, A123 [NASA ADS] [CrossRef] [EDP Sciences] [Google Scholar]
- Boselli, A., Fossati, M., Roediger, J., et al. 2023b, A&A, 669, A73 [NASA ADS] [CrossRef] [EDP Sciences] [Google Scholar]
- Boselli, A., Serra, P., De Gasperin, F., et al. 2023c, A&A, 676, A92 [NASA ADS] [CrossRef] [EDP Sciences] [Google Scholar]
- Brown, T., Wilson, C. D., Zabel, N., et al. 2021, Astrophys. J. Suppl. Ser., 257, 21 [NASA ADS] [CrossRef] [Google Scholar]
- Cantiello, M., Blakeslee, J. P., Ferrarese, L., et al. 2018, ApJ, 856, 126 [Google Scholar]
- Cantiello, M., Blakeslee, J. P., Ferrarese, L., et al. 2024, ApJ, 966, 145 [NASA ADS] [CrossRef] [Google Scholar]
- Capetti, A., Kharb, P., Axon, D. J., Merritt, D., & Baldi, R. D. 2009, Astron. J., 138, 1990 [NASA ADS] [CrossRef] [Google Scholar]
- Catinella, B., Saintonge, A., Janowiecki, S., et al. 2018, MNRAS, 476, 875 [NASA ADS] [CrossRef] [Google Scholar]
- Cattorini, F., Gavazzi, G., Boselli, A., & Fossati, M. 2023, A&A, 671, A118 [NASA ADS] [CrossRef] [EDP Sciences] [Google Scholar]
- Chen, H., Sun, M., Yagi, M., et al. 2020, MNRAS, 496, 4654 [CrossRef] [Google Scholar]
- Chung, A., van Gorkom, J. H., Kenney, J. D. P., & Vollmer, B. 2007, ApJ, 659, L115 [Google Scholar]
- Chung, A., Van Gorkom, J. H., Kenney, J. D., Crowl, H., & Vollmer, B. 2009, Astron. J., 138, 1741 [NASA ADS] [CrossRef] [Google Scholar]
- Churazov, E., & Kaiser, C. 2001, ApJ, 10, 261 [NASA ADS] [CrossRef] [Google Scholar]
- Ciesla, L., Boselli, A., Smith, M. W. L., et al. 2012, A&A, 543, A161 [NASA ADS] [CrossRef] [EDP Sciences] [Google Scholar]
- Condon, J. J., Cotton, W. D., Greisen, E. W., et al. 1998, Astron. J., 8065, 1693 [NASA ADS] [CrossRef] [Google Scholar]
- Cortese, L., Catinella, B., Boissier, S., Boselli, A., & Heinis, S. 2011, MNRAS, 415, 1797 [Google Scholar]
- Cortese, L., Fritz, J., Bianchi, S., et al. 2014, MNRAS, 440, 942 [Google Scholar]
- Cote, P., Blakeslee, J. P., Ferrarese, L., et al. 2004, Astrophys. J. Suppl. Ser., 153, 223 [NASA ADS] [CrossRef] [Google Scholar]
- Davies, J. I., Baes, M., Bendo, G. J., et al. 2010, A&A, 518, L48 [NASA ADS] [CrossRef] [EDP Sciences] [Google Scholar]
- De Gasperin, F., Orrú, E., Murgia, M., et al. 2012, A&A, 547, A56 [NASA ADS] [CrossRef] [EDP Sciences] [Google Scholar]
- De Gasperin, F., Mevius, M., Rafferty, D. A., Intema, H. T., & Fallows, R. A. 2018, A&A, 615, A179 [NASA ADS] [CrossRef] [EDP Sciences] [Google Scholar]
- De Gasperin, F., Dijkema, T. J., Drabent, A., et al. 2019, A&A, 622, A5 [NASA ADS] [CrossRef] [EDP Sciences] [Google Scholar]
- De Gasperin, F., Vink, J., McKean, J. P., et al. 2020a, A&A, 635, A150 [NASA ADS] [CrossRef] [EDP Sciences] [Google Scholar]
- De Gasperin, F., Brunetti, G., Bruggen, M., et al. 2020b, A&A, 642, A85 [NASA ADS] [CrossRef] [EDP Sciences] [Google Scholar]
- De Gasperin, F., Williams, W. L., Best, P., et al. 2021, A&A, 648, A104 [NASA ADS] [CrossRef] [EDP Sciences] [Google Scholar]
- Dressler, A. 1980, ApJ, 236, 351 [Google Scholar]
- Duchesne, S. W., Thomson, A. J., Pritchard, J., et al. 2023, Publ. Astron. Soc. Aust., 40, e034 [CrossRef] [Google Scholar]
- Edler, H. W., De Gasperin, F., Shimwell, T. W., et al. 2023, A&A, 676, A24 [NASA ADS] [CrossRef] [EDP Sciences] [Google Scholar]
- Edler, H. W., Roberts, I. D., Boselli, A., et al. 2024, A&A, 683, A149 [NASA ADS] [CrossRef] [EDP Sciences] [Google Scholar]
- Event Horizon Telescope Collaboration (Akiyama, K., et al.) 2019, Astrophys. J., 875, L1 [NASA ADS] [CrossRef] [Google Scholar]
- Fabbiano, G., Kim, D.-W., & Trinchieri, G. 1992, Astrophys. J. Suppl. Ser., 80, 531 [NASA ADS] [CrossRef] [Google Scholar]
- Fabian, A. C. 2012, Annu. Rev. Astron. Astrophys., 50, 455 [CrossRef] [Google Scholar]
- Ferrarese, L., Côté, P., Cuillandre, J. C., et al. 2012, Astrophys. Journal, Suppl. Ser., 200, 4 [NASA ADS] [CrossRef] [Google Scholar]
- Ferrarese, L., Côté, P., MacArthur, L. A., et al. 2020, ApJ, 890, 128 [Google Scholar]
- Forman, W., Jones, C., Churazov, E., et al. 2007, ApJ, 665, 1057 [NASA ADS] [CrossRef] [Google Scholar]
- Fossati, M., Fumagalli, M., Boselli, A., et al. 2016, MNRAS, 455, 2028 [Google Scholar]
- Gallo, E., Treu, T., Jacob, J., et al. 2008, ApJ, 680, 154 [NASA ADS] [CrossRef] [Google Scholar]
- Gallo, E., Treu, T., Marshall, P. J., et al. 2010, ApJ, 714, 25 [NASA ADS] [CrossRef] [Google Scholar]
- Gavazzi, G., & Boselli, A. 1999a, A&A, 343, 86 [NASA ADS] [Google Scholar]
- Gavazzi, G., & Boselli, A. 1999b, A&A, 343, 93 [NASA ADS] [Google Scholar]
- Gavazzi, G., Boselli, A., & Kennicutt, R. 1991, AJ, 101, 1207 [NASA ADS] [CrossRef] [Google Scholar]
- Gavazzi, G., Contursi, A., Carrasco, L., et al. 1995, A&A, 304, 325 [NASA ADS] [Google Scholar]
- Gavazzi, G., Bonfanti, C., Sanvito, G., Boselli, A., & Scodeggio, M. 2002, ApJ, 576, 135 [NASA ADS] [CrossRef] [Google Scholar]
- Gavazzi, G., Boselli, A., Van Driel, W., & O’Neil, K. 2005, A&A, 429, 439 [NASA ADS] [CrossRef] [EDP Sciences] [Google Scholar]
- Gavazzi, G., Fumagalli, M., Fossati, M., et al. 2013, A&A, 553, A89 [NASA ADS] [CrossRef] [EDP Sciences] [Google Scholar]
- Geller, M. J., & Huchra, J. P. 1989, Science, 246, 897 [NASA ADS] [CrossRef] [Google Scholar]
- Giovanelli, R., Haynes, M. P., Kent, B. R., et al. 2005, Astron. J., 130, 2598 [NASA ADS] [CrossRef] [Google Scholar]
- Gunn, J. E., & Gott, J. R., III 1972, ApJ, 176, 1 [Google Scholar]
- Haynes, M. P., Giovanelli, R., & Kent, B. R. 2007, ApJ, 665, L19 [CrossRef] [Google Scholar]
- Haynes, M. P., Giovanelli, R., Kent, B. R., et al. 2018, ApJ, 861, 49 [Google Scholar]
- Hoffman, G. L., Lewis, B. M., & Salpeter, E. E. 1995, ApJ, 441, 28 [NASA ADS] [CrossRef] [Google Scholar]
- Hou, M., Hu, Z., & Li, Z. 2024, Astrophys. J., 965, L24 [NASA ADS] [CrossRef] [Google Scholar]
- Hurley-Walker, N., Callingham, J. R., Hancock, P. J., et al. 2017, MNRAS, 464, 1146 [Google Scholar]
- Ignesti, A., Vulcani, B., Poggianti, B. M., et al. 2022, ApJ, 924, 64 [NASA ADS] [CrossRef] [Google Scholar]
- Ignesti, A., Vulcani, B., Botteon, A., et al. 2023, A&A, 675, A118 [NASA ADS] [CrossRef] [EDP Sciences] [Google Scholar]
- Intema, H. T., Jagannathan, P., Mooley, K. P., & Frail, D. A. 2017, A&A, 598, A78 [NASA ADS] [CrossRef] [EDP Sciences] [Google Scholar]
- Janz, J., Laurikainen, E., Lisker, T., et al. 2014, ApJ, 786, 105 [Google Scholar]
- Jonas, J. L. 2016, in Proc. Sci. (Sissa Medialab Srl), 1 [Google Scholar]
- Jones, M. G., Janowiecki, S., Dey, S., et al. 2024, ApJ, 966, L15 [Google Scholar]
- Junais, Boissier, S., Boselli, A., et al. 2022, A&A, 667, A76 [NASA ADS] [CrossRef] [EDP Sciences] [Google Scholar]
- Kennicutt, R. C., Jr. 1998, ARA&A, 36, 189 [Google Scholar]
- Kent, B. R., Giovanelli, R., Haynes, M. P., et al. 2007, ApJ, 665, L15 [NASA ADS] [CrossRef] [Google Scholar]
- Kent, B. R., Spekkens, K., Giovanelli, R., et al. 2009, ApJ, 691, 1595 [NASA ADS] [CrossRef] [Google Scholar]
- Kim, S., Rey, S. C., Jerjen, H., et al. 2015, Astrophys. Journal, Suppl. Ser., 215, 22 [Google Scholar]
- Klypin, A., Hoffman, Y., Kravtsov, A. V., & Gottlober, S. 2003, ApJ, 596, 19 [NASA ADS] [CrossRef] [Google Scholar]
- Koopmann, R. A., Kenney, J. D. P., & Young, J. 2001, Astrophys. J. Suppl. Ser., 135, 125 [NASA ADS] [CrossRef] [Google Scholar]
- Koopmann, R. A., Giovanelli, R., Haynes, M. P., et al. 2008, ApJ, 682, L85 [NASA ADS] [CrossRef] [Google Scholar]
- Koribalski, B. S., Staveley-Smith, L., Westmeier, T., et al. 2020, Astrophys. Space Sci., 365, 118 [NASA ADS] [CrossRef] [Google Scholar]
- Lane, W. M., Cotton, W. D., van Velzen, S., et al. 2014, MNRAS, 440, 327 [Google Scholar]
- Larson, R. B., Tinsley, B. M., & Caldwell, C. N. 1980, ApJ, 237, 692 [Google Scholar]
- Leech, K. J., Völk, H. J., Heinrichsen, I., et al. 1999, MNRAS, 310, 317 [NASA ADS] [CrossRef] [Google Scholar]
- Lim, S., Côté, P., Peng, E. W., et al. 2020, ApJ, 899, 69 [CrossRef] [Google Scholar]
- Lisker, T., Grebel, E. K., & Binggeli, B. 2006a, Astron. J., 132, 497 [NASA ADS] [CrossRef] [Google Scholar]
- Lisker, T., Glatt, K., Westera, P., & Grebel, E. K. 2006b, Astron. J., 132, 2432 [NASA ADS] [CrossRef] [Google Scholar]
- Lisker, T., Grebel, E. K., Binggeli, B., & Glatt, K. 2007, ApJ, 660, 1186 [Google Scholar]
- Liu, C., Côté, P., Peng, E. W., et al. 2020, Astrophys. J. Suppl. Ser., 250, 17 [NASA ADS] [CrossRef] [Google Scholar]
- Longobardi, A., Boselli, A., Boissier, S., et al. 2020a, A&A, 633, L7 [NASA ADS] [CrossRef] [EDP Sciences] [Google Scholar]
- Longobardi, A., Boselli, A., Fossati, M., et al. 2020b, A&A, 644, A161 [EDP Sciences] [Google Scholar]
- Lu, R.-S., Asada, K., Krichbaum, T. P., et al. 2023, Nature, 616, 686 [CrossRef] [Google Scholar]
- Martin, A. M., Papastergis, E., Giovanelli, R., et al. 2010, ApJ, 723, 1359 [NASA ADS] [CrossRef] [Google Scholar]
- McCall, H., Reiprich, T. H., Veronica, A., et al. 2024, A&A, 689, A113 [NASA ADS] [CrossRef] [EDP Sciences] [Google Scholar]
- McConnell, D., Hale, C. L., Lenc, E., et al. 2020, Publ. Astron. Soc. Aust., 37, e048 [CrossRef] [Google Scholar]
- McDonald, M., Courteau, S., Tully, R. B., & Roediger, J. 2011, MNRAS, 414, 2055 [NASA ADS] [CrossRef] [Google Scholar]
- McLaughlin, D. E. 1999, ApJ, 512, L9 [Google Scholar]
- Mei, S., Blakeslee, J. P., Cote, P., et al. 2007, ApJ, 655, 144 [NASA ADS] [CrossRef] [Google Scholar]
- Meyer, M. J., Zwaan, M. A., Webster, R. L., et al. 2004, MNRAS, 350, 1195 [Google Scholar]
- Million, E. T., Werner, N., Simionescu, a., et al. 2010, MNRAS, 407, 2046 [NASA ADS] [CrossRef] [Google Scholar]
- Minchin, R., Davies, J., Disney, M., et al. 2007, ApJ, 670, 1056 [NASA ADS] [CrossRef] [Google Scholar]
- Minchin, R. F., Taylor, R., Köppen, J., et al. 2019, AJ, 158, 121 [NASA ADS] [CrossRef] [Google Scholar]
- Moore, B., Lake, G., & Katz, N. 1998, ApJ, 495, 139 [Google Scholar]
- Moorman, C. M., Vogeley, M. S., Hoyle, F., et al. 2014, MNRAS, 444, 3559 [NASA ADS] [CrossRef] [Google Scholar]
- Muñoz, R. P., Puzia, T. H., Lançon, A., et al. 2014, Astrophys. Journal, Suppl. Ser., 210, 4 [Google Scholar]
- Murgia, M., Govoni, F., Feretti, L., et al. 2004, A&A, 424, 429 [NASA ADS] [CrossRef] [EDP Sciences] [Google Scholar]
- Murphy, E. J., Kenney, J. D. P., Helou, G., Chung, A., & Howell, J. H. 2009, ApJ, 694, 1435 [CrossRef] [Google Scholar]
- Niklas, S., Klein, U., & Wielebinski, R. 1995, A&A, 293, 56 [NASA ADS] [Google Scholar]
- Norris, R. P., Marvil, J., Collier, J. D., et al. 2021, Publ. Astron. Soc. Aust., 38, e046 [CrossRef] [Google Scholar]
- Osinga, E., Van Weeren, R. J., Andrade-Santos, F., et al. 2022, A&A, 665, A71 [NASA ADS] [CrossRef] [EDP Sciences] [Google Scholar]
- O’Sullivan, S. P., Shimwell, T. W., Hardcastle, M. J., et al. 2023, MNRAS, 519, 5723 [CrossRef] [Google Scholar]
- Owen, F., & Biretta, J. 1999, VLA 7mm images of the M 87 jet (Roser Hermann-Josef and Meisenheimer Klaus), 530, 186 [NASA ADS] [Google Scholar]
- Owen, F., Eilek, J., & Kassim, N. 2000, ApJ, 543, 611 [NASA ADS] [CrossRef] [Google Scholar]
- Peek, J. E. G., Heiles, C., Douglas, K. A., et al. 2011, ApJS, 194, 20 [NASA ADS] [CrossRef] [Google Scholar]
- Raichoor, A., Mei, S., Erben, T., et al. 2014, ApJ, 797, 102 [Google Scholar]
- Ramatsoku, M., Murgia, M., Vacca, V., et al. 2020, A&A, 636, L1 [NASA ADS] [CrossRef] [EDP Sciences] [Google Scholar]
- Reynolds, R. J., Tufte, S. L., Haffner, L. M., Jaehnig, K., & Percival, J. W. 1998, PASA, 15, 14 [NASA ADS] [CrossRef] [Google Scholar]
- Roberts, I. D., van Weeren, R. J., McGee, S. L., et al. 2021a, A&A, 650, A111 [NASA ADS] [CrossRef] [EDP Sciences] [Google Scholar]
- Roberts, I. D., van Weeren, R. J., McGee, S. L., et al. 2021b, A&A, 652, A153 [NASA ADS] [CrossRef] [EDP Sciences] [Google Scholar]
- Roberts, I. D., van Weeren, R. J., Timmerman, R., et al. 2022, A&A, 658, A44 [NASA ADS] [CrossRef] [EDP Sciences] [Google Scholar]
- Roberts, I. D., van Weeren, R. J., Lal, D. V., et al. 2024, A&A, 683, A11 [NASA ADS] [CrossRef] [EDP Sciences] [Google Scholar]
- Rosenberg, J. L., & Schneider, S. E. 2002, ApJ, 567, 247 [NASA ADS] [CrossRef] [Google Scholar]
- Rudnick, L., & Owen, F. N. 2014, ApJ, 785, 45 [Google Scholar]
- Ruszkowski, M., Brüggen, M., Lee, D., & Shin, M. S. 2014, ApJ, 784, 75 [NASA ADS] [CrossRef] [Google Scholar]
- Said, K., Kraan-Korteweg, R. C., & Staveley-Smith, L. 2019, MNRAS, 486, 1796 [NASA ADS] [CrossRef] [Google Scholar]
- Saintonge, A., & Catinella, B. 2022, Annu. Rev. Astron. Astrophys., 60, 319 [CrossRef] [Google Scholar]
- Sandage, A., Binggeli, B., & Tammann, G. A. 1985, Astron. J., 90, 395 [NASA ADS] [CrossRef] [Google Scholar]
- Saul, D. R., Peek, J. E. G., Grcevich, J., et al. 2012, ApJ, 758, 44 [NASA ADS] [CrossRef] [Google Scholar]
- Schinnerer, E., Smolčić, V., Carilli, C. L., et al. 2007, ApJS, 172, 46 [Google Scholar]
- Serra, P., MacCagni, F. M., Kleiner, D., et al. 2023, A&A, 673, A146 [NASA ADS] [CrossRef] [EDP Sciences] [Google Scholar]
- Shapley, A., Fabbiano, G., & Eskridge, P. B. 2001, ApJS, 137, 139 [NASA ADS] [CrossRef] [Google Scholar]
- Shimwell, T. W., Tasse, C., Hardcastle, M. J., et al. 2019, A&A, 622, A1 [NASA ADS] [CrossRef] [EDP Sciences] [Google Scholar]
- Shimwell, T. W., Hardcastle, M. J., Tasse, C., et al. 2022, A&A, 659, A1 [NASA ADS] [CrossRef] [EDP Sciences] [Google Scholar]
- Simionescu, A., Werner, N., Mantz, A., Allen, S. W., & Urban, O. 2017, MNRAS, 469, 1476 [Google Scholar]
- Smolčić, V., Novak, M., Bondi, M., et al. 2017, A&A, 602, A1 [Google Scholar]
- Sorgho, A., Hess, K., Carignan, C., & Oosterloo, T. A. 2017, MNRAS, 464, 530 [NASA ADS] [CrossRef] [Google Scholar]
- Soria, R., Kolehmainen, M., Graham, A. W., et al. 2022, MNRAS, 512, 3284 [NASA ADS] [CrossRef] [Google Scholar]
- Spasic, A., Edler, H. W., Su, Y., et al. 2024, A&A, 690, A195 [NASA ADS] [CrossRef] [EDP Sciences] [Google Scholar]
- Tasse, C., Shimwell, T., Hardcastle, M. J., et al. 2021, A&A, 648, A1 [EDP Sciences] [Google Scholar]
- Taylor, A. R., Sekhar, S., Heino, L., et al. 2024, MNRAS, 528, 2511 [NASA ADS] [CrossRef] [Google Scholar]
- Tonnesen, S., & Bryan, G. L. 2010, ApJ, 709, 1203 [NASA ADS] [CrossRef] [Google Scholar]
- Tonnesen, S., & Bryan, G. L. 2012, MNRAS, 422, 1609 [CrossRef] [Google Scholar]
- Tonnesen, S., & Stone, J. 2014, ApJ, 795, 148 [NASA ADS] [CrossRef] [Google Scholar]
- Tonnesen, S., Bryan, G. L., & Chen, R. 2011, ApJ, 731, 98 [NASA ADS] [CrossRef] [Google Scholar]
- Tuffs, R. J., Popescu, C. C., Pierini, D., et al. 2002, Astrophys. J. Suppl. Ser., 139, 37 [NASA ADS] [CrossRef] [Google Scholar]
- Urban, O., Werner, N., Simionescu, A., Allen, S. W., & Böhringer, H. 2011, MNRAS, 414, 2101 [NASA ADS] [CrossRef] [Google Scholar]
- van Haarlem, M. P., Wise, M. W., Gunst, a. W., et al. 2013, A&A, 556, A2 [NASA ADS] [CrossRef] [EDP Sciences] [Google Scholar]
- Völk, H. J., & Xu, C. 1994, Infrared Phys. Technol., 35, 527 [CrossRef] [Google Scholar]
- Vollmer, B., Cayatte, V., Balkowski, C., & Duschl, W. J. 2001, ApJ, 561, 708 [NASA ADS] [CrossRef] [Google Scholar]
- Vollmer, B., Thierbach, M., & Wielebinski, R. 2004, A&A, 418, 1 [NASA ADS] [CrossRef] [EDP Sciences] [Google Scholar]
- Vollmer, B., Soida, M., Chung, A., et al. 2008, A&A, 483, 89 [NASA ADS] [CrossRef] [EDP Sciences] [Google Scholar]
- Vollmer, B., Soida, M., Chung, A., et al. 2009, A&A, 496, 669 [NASA ADS] [CrossRef] [EDP Sciences] [Google Scholar]
- Vollmer, B., Soida, M., Braine, J., et al. 2012, A&A, 537, A143 [NASA ADS] [CrossRef] [EDP Sciences] [Google Scholar]
- Vollmer, B., Pappalardo, C., Soida, M., & Lançon, A. 2018, A&A, 620, A108 [NASA ADS] [CrossRef] [EDP Sciences] [Google Scholar]
- Vollmer, B., Fossati, M., Boselli, A., et al. 2021, A&A, 645, A121 [EDP Sciences] [Google Scholar]
- Vollmer, B., Soida, M., & Dallant, J. 2022, A&A, 667, A30 [NASA ADS] [CrossRef] [EDP Sciences] [Google Scholar]
- Wright, E. L., Eisenhardt, P. R., Mainzer, A. K., et al. 2010, Astron. J., 140, 1868 [NASA ADS] [CrossRef] [Google Scholar]
- Zhang, C., Churazov, E., & Schekochihin, A. A. 2018, MNRAS, 478, 4785 [NASA ADS] [CrossRef] [Google Scholar]
- Zwaan, M. A., Briggs, F. H., Sprayberry, D., & Sorar, E. 1997, ApJ, 490, 173 [NASA ADS] [CrossRef] [Google Scholar]
- Zwaan, M. A., Meyer, M. J., Staveley-Smith, L., & Webster, R. L. 2005, MNRAS, 359, L30 [NASA ADS] [CrossRef] [Google Scholar]
All Tables
All Figures
|
Fig. 1. Frequency – sensitivity plot comparing large radio surveys covering the Virgo cluster. The size of the markers scales linearly with resolution from 7″ of ViCTORIA LOFAR HBA to 150″ of GLEAM. The sensitivity is derived from the Virgo region. References: GLEAM (GaLactic and Extragalactic All-sky Murchison Widefield Array survey; Hurley-Walker et al. 2017), TGSS ADR1 (TIFR GMRT Sky Survey – Alternative Data Release 1; Intema et al. 2017); VLSSr (VLA Low-frequency Sky Survey redux; Lane et al. 2014); NVSS (1.4 GHz NRAO VLA Sky Survey; Condon et al. 1998); RACS (Rapid ASKAP Continuum Survey) -low (McConnell et al. 2020) and -mid (Duchesne et al. 2023). |
| In the text | |
|
Fig. 2. Coverage of ViCTORIA project surveys. In green are the pointings at mid-frequency FWHM of the MeerKAT Virgo Survey designed to fill the orange region covered by NGVS in optical and VESTIGE in H α. In light and dark blue are the coverages of LOFAR LBA and HBA, respectively (mid-frequency FWHM). The red dashed line is the estimated r200. The contours trace the X-ray emission from ROSAT (Böhringer et al. 1994), grey dots are VCC galaxies with recessional velocity ≤ 3000 km s−1, and red dots mark cluster galaxies that we expect to detect based on their H α-brightness. |
| In the text | |
|
Fig. 3. MeerKAT L-band data mosaic of five pointings covering M 87 and moving towards the north-east. These fields were used as a pilot experiment to derive a good calibration strategy. The dynamic range limitation due to the presence of the bright radio emission from M 87 is evident in the increased rms noise in the pointings where the source is within the primary beam. |
| In the text | |
|
Fig. 4. H I gas distribution of perturbed galaxy NGC 4424 seen by ViCTORIA. For each resolution, we show the lowest reliable contour (3σ over a line width of 25 km s−1). The contours are overlaid on an r-band image downloaded from the Legacy Survey database. The contour levels and resolutions are listed in the legend at the bottom, and the resolutions are shown in the top left corner. For comparison, we also show the lowest reliable H I contour from the VIVA survey (Chung et al. 2009), defined for consistency at a 3σ level over a line width of 25 km s−1. |
| In the text | |
|
Fig. 5. H I clouds detected during ALFALFA survey by Kent et al. (2009) as seen by ViCTORIA. For each resolution, we show the lowest reliable contour (3σ over a line width of 25 km s−1). The contours are overlaid on an r-band image downloaded from the Legacy Survey database. The contour levels and resolutions are listed in the legend at the bottom, and the resolutions are shown in the top left corner. |
| In the text | |
|
Fig. 6. Comparison of various surveys in L band: ViCTORIA MeerKAT (from the pilot fields shown in Fig. 3), NVSS, and RACS low and mid. The circles show the locations of NGC 4548, NGC 4501 and IC 3476 (from top left to bottom right). |
| In the text | |
|
Fig. 7. H I gas distribution of NGC 4523. For each resolution, we show the lowest reliable contour (3σ over a line width of 25 km s−1). The contours are overlaid on an r-band image downloaded from the Legacy Survey database. The contour levels and resolutions are listed in the legend at the bottom, and the resolutions are shown in the top left corner. At the highest resolution of 15″, we also show an additional contour at a 5× higher column density than the lowest reliable contour. These H I images reach column densities a factor of |
| In the text | |
|
Fig. 8. Virgo A (the radio emission associated with M87) as seen by the three ViCTORIA surveys (de Gasperin et al., in prep.). From left to right: LOFAR LBA (54 MHz, beam: 16″ × 12″), LOFAR HBA (144 MHz, beam: 4″ × 3″ including LOFAR international stations), and MeerKAT L band (1284 MHz, beam: 12″ × 6″). The beam size is shown in the bottom left corner of each image. |
| In the text | |
|
Fig. 9. Extract from central panel of Fig. 8, where the collimated synchrotron thread is visible and joins the two ‘ears’. |
| In the text | |
Current usage metrics show cumulative count of Article Views (full-text article views including HTML views, PDF and ePub downloads, according to the available data) and Abstracts Views on Vision4Press platform.
Data correspond to usage on the plateform after 2015. The current usage metrics is available 48-96 hours after online publication and is updated daily on week days.
Initial download of the metrics may take a while.