Fig. 7.
Download original image
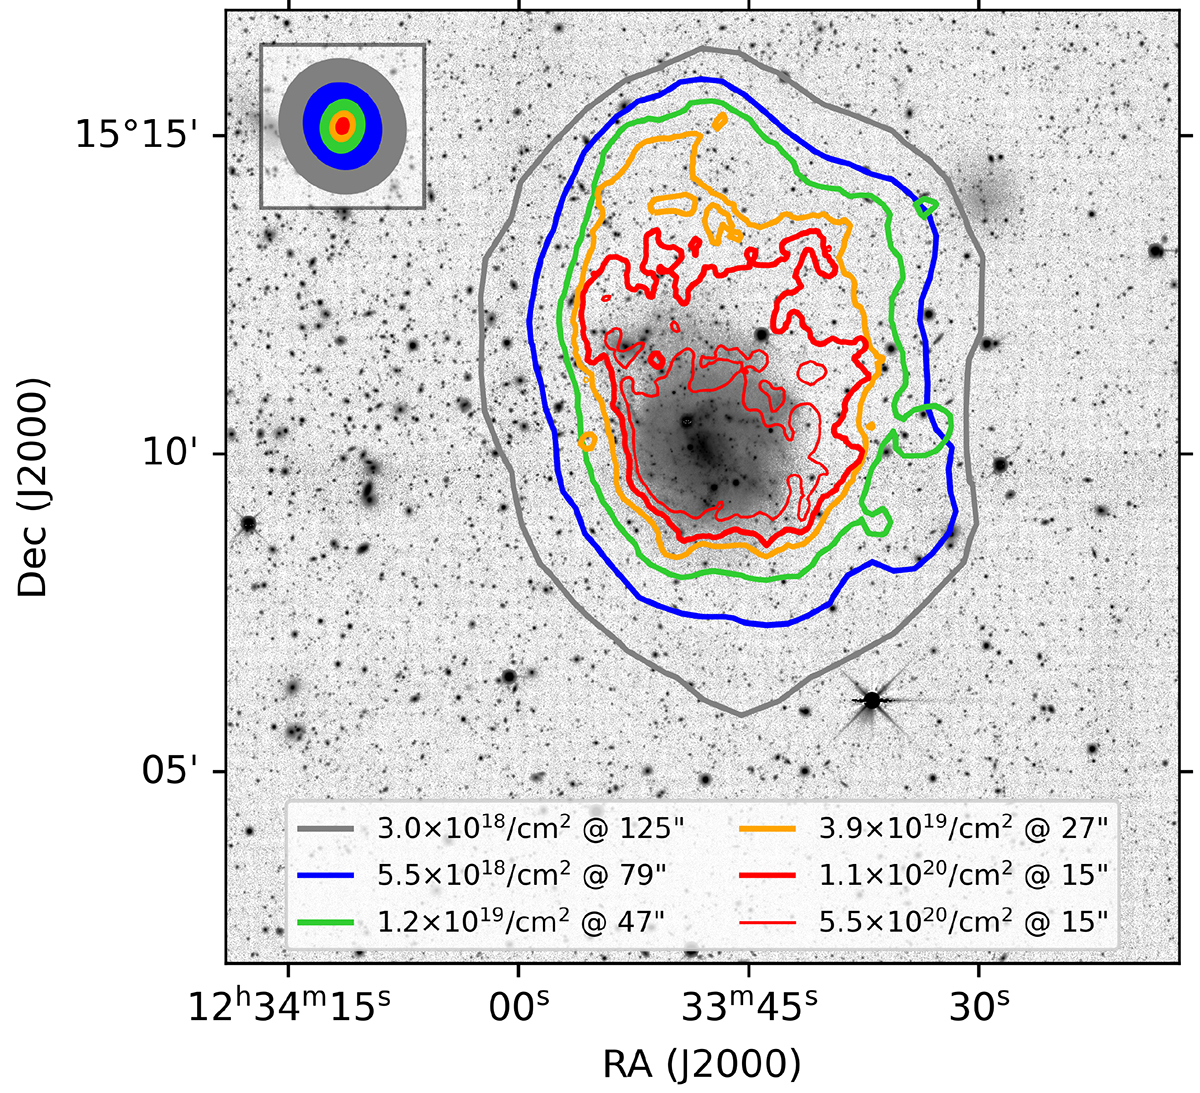
H I gas distribution of NGC 4523. For each resolution, we show the lowest reliable contour (3σ over a line width of 25 km s−1). The contours are overlaid on an r-band image downloaded from the Legacy Survey database. The contour levels and resolutions are listed in the legend at the bottom, and the resolutions are shown in the top left corner. At the highest resolution of 15″, we also show an additional contour at a 5× higher column density than the lowest reliable contour. These H I images reach column densities a factor of ![]() better than those reached during the pilot observations published in Boselli et al. (2023c).
better than those reached during the pilot observations published in Boselli et al. (2023c).
Current usage metrics show cumulative count of Article Views (full-text article views including HTML views, PDF and ePub downloads, according to the available data) and Abstracts Views on Vision4Press platform.
Data correspond to usage on the plateform after 2015. The current usage metrics is available 48-96 hours after online publication and is updated daily on week days.
Initial download of the metrics may take a while.