Open Access
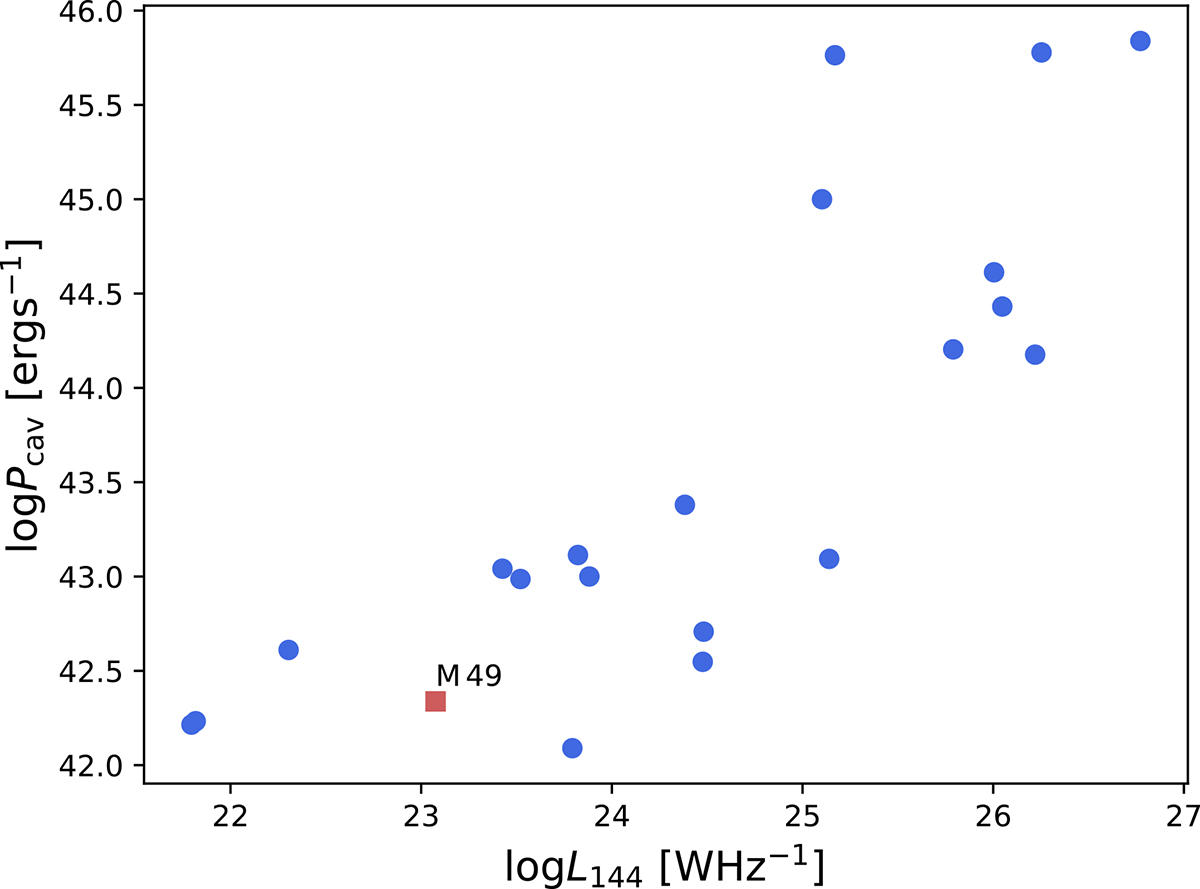
Fig. 8.
Download original image
Cavity power against the total radio luminosity of each source. The plot was created using the data from Bîrzan et al. (2020). The point marked as a red square was added using the cavity power estimated for NGC 4472 (M 49) in this work.
Current usage metrics show cumulative count of Article Views (full-text article views including HTML views, PDF and ePub downloads, according to the available data) and Abstracts Views on Vision4Press platform.
Data correspond to usage on the plateform after 2015. The current usage metrics is available 48-96 hours after online publication and is updated daily on week days.
Initial download of the metrics may take a while.