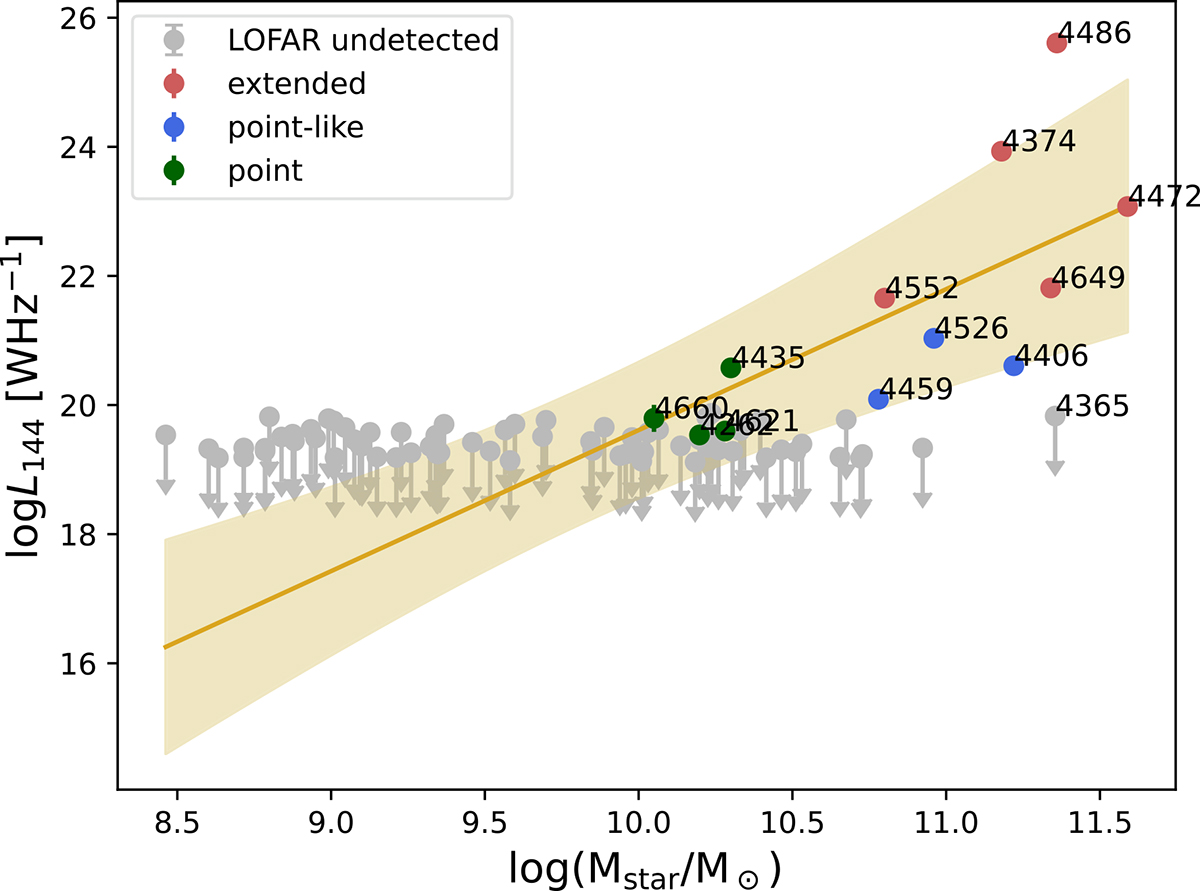
Fig. 1.

Download original image
Stellar mass against the total radio luminosity for all galaxies in the sample. The different colours in the plot mark their morphological classification: extended sources are shown in red, point-like sources in blue, and point sources are coloured green. The grey points are upper limits derived for the galaxies that were not detected at 144 MHz 4σ. The yellow line shows the best-fitting relation and its 1σ uncertainty band.
Current usage metrics show cumulative count of Article Views (full-text article views including HTML views, PDF and ePub downloads, according to the available data) and Abstracts Views on Vision4Press platform.
Data correspond to usage on the plateform after 2015. The current usage metrics is available 48-96 hours after online publication and is updated daily on week days.
Initial download of the metrics may take a while.


