| Issue |
A&A
Volume 676, August 2023
|
|
|---|---|---|
| Article Number | A102 | |
| Number of page(s) | 31 | |
| Section | Extragalactic astronomy | |
| DOI | https://doi.org/10.1051/0004-6361/202346529 | |
| Published online | 17 August 2023 | |
The LOFAR view of massive early-type galaxies: Transition from radio AGN to host emission
1
INAF – Osservatorio Astrofisico di Torino, Strada Osservatorio 20, 10025 Pino Torinese, Italy
e-mail: This email address is being protected from spambots. You need JavaScript enabled to view it.
2
INAF – Osservatorio di Astrofisica e Scienza dello Spazio di Bologna, Via Gobetti 93/3, 40129 Bologna, Italy
3
Dipartimento di Fisica e Astronomia, Università di Bologna, Via P. Gobetti 93/2, Bologna, Italy
Received:
29
March
2023
Accepted:
16
June
2023
Abstract
We extend the study of the radio emission in early-type galaxies (ETGs) in the nearby Universe (recession velocity < 7500 km s−1) as seen by the 150 MHz Low-Frequency ARray (LOFAR) observations and extend the sample from giant ETGs to massive (∼6 × 10¹⁰ − 3 × 10¹¹ M⊙) ETGs (mETGS) with −25 < MK < −23.5. Images from the second data release of the LOFAR Two-metre Sky Survey were available for 432 mETGs, 48% of which are detected above a typical luminosity of ∼3 × 10²⁰ W Hz−1. Most (85%) of the detected sources are compact, with sizes ≲4 kpc. The radio emission of 31 mETGs is extended on scales ranging from 2 to 180 kpc (median 12 kpc). In several cases, it is aligned with the host galaxy. We set a limit of ≲1% to the fraction of remnant or restarted objects, which is ≲16% of the extended sources. We found that the properties of the radio sources are connected with the stellar mass of the ETGs (the median radio power, the fraction of extended radio sources, and the link with the large-scale environment). However, these results only describe statistical trends because the radio properties of sources of similar stellar mass and environment show a large spread of radio properties. These trends break at the lowest host luminosities (MK > −24.5). This effect is strengthened by the analysis of even less massive ETGs, with −23.5 < MK < −21.5. This suggests that at a mass of ∼2 × 10¹¹ M⊙, a general transition occurs from radio emission produced from radio-loud active galactic nuclei (AGN) to processes related to the host galaxy and (or) radio quiet AGN. At this luminosity, a transition in the stellar surface brightness profile also occurs from Sérsic galaxies to those with a depleted stellar core, the so-called core galaxies. This finding is in line with previous results that indicated that only core galaxies host radio-loud AGN.
Key words: galaxies: active / galaxies: jets
© The Authors 2023
 Open Access article, published by EDP Sciences, under the terms of the Creative Commons Attribution License (https://creativecommons.org/licenses/by/4.0), which permits unrestricted use, distribution, and reproduction in any medium, provided the original work is properly cited.
This article is published in open access under the Subscribe to Open model. This email address is being protected from spambots. You need JavaScript enabled to view it. to support open access publication.
1. Introduction
Radio-mode feedback, that is, the interplay between the transfer of energy and matter from relativistic jets to the external medium and the accretion powering active galactic nuclei (AGNs), is an essential ingredient in the evolution of galaxies (e.g., Fabian 2012). The energy injected by relativistic jets is thought to quench star formation and produce the exponential cutoff at the bright end of the galaxy luminosity function (Croton et al. 2006). Powerful radio sources are almost invariably associated with early-type galaxies (ETGs) with high black hole masses, MSMBH ≳ 108 M⊙ (Baldi et al. 2010; Chiaberge & Marconi 2011). In order to understand how radio-mode feedback operates, it is necessary to explore the properties and the origin of the radio emission in massive ETGs to study their morphology and to explore their duty cycle.
In recent years, the advent of new-generation radio facilities has allowed major progress in this field, especially because much lower flux limits than previously accessible could be explored. For example, it has become clear that the extended and powerful radio galaxies (hundreds of kiloparsec, kpc, with L ≳ 1024 W Hz−1), which dominated the historical 3C and B2 radio samples, clearly represent only a small part of the entire radio AGN population. The bulk of radio AGN instead has low radio powers and sizes smaller than a few kpc (e.g., Best et al. 2005a; Baldi et al. 2015; Hardcastle et al. 2019). In analogy to the historical radiogalaxy classification into FRI or FRII (Fanaroff & Riley 1974), this population of compact radio sources was named FR0s. It is still debated why most radio sources do not develop large-scale jets, but it is likely due to a combination of different intrinsic properties of the black hole (e.g., mass and spin) and the mass of the host, its environment, and the jet duty cycle.
Even the classical FRI/FRII dichotomy (low power/edge-darkened versus high-power/edge-brightened radio galaxies) has recently started to be questioned. Large samples of extended sources at high sensitivity have indeed shown that there is a very large overlap in luminosity for the two morphologies. In particular, a population of low-power FR IIs was revealed (e.g., Capetti et al. 2017; Mingo et al. 2019, 2022). They appear to be associated with lower-mass hosts and reach radio luminosities lower by three orders of magnitude of the traditional FR break (∼1025 W Hz−1 at 1.4 GHz, Ledlow & Owen 1996). Two main scenarios have long been discussed in the literature to explain the difference between FRI and FRII morphology. The first scenario suggests that FRIs live in more massive galaxies and denser environments, which are able to decelerate their jets with respect to FRIIs. The second scenario suggests instead that there is a more intrinsic difference in the jet formation of these two classes of sources, or that it might be related to a different accretion process (radiatively efficient versus radiatively inefficient). However, while the large predominance of FRI radio galaxies seem to be associated with radiatively inefficient accretion, FRII sources can clearly be both: Up to 65% of the luminous FRIIs (L150 ≳ 1026 W Hz−1) are radiatively inefficient (e.g., Miraghaei & Best 2017; Mingo et al. 2022).
To explore all this further, in Capetti et al. (2022, hereafter Paper I), we studied the properties and the origin of the low-frequency radio emission in the most luminous giant ETGs (gETGs) in the local Universe (recession velocity ≤7500 km s−1). Low-Frequency ARray (LOFAR; Shimwell et al. 2017) observations at 150 MHz that were obtained as part of the LOFAR Two-metre Sky Survey (LoTSS) were available for 188 out of the 489 selected galaxies at the time of this analysis. We confirmed the positive correlation between the stellar luminosity of gETGs and their median radio power that has been reported by previous studies (Colla et al. 1975; Fanti et al. 1978; Sadler et al. 1989; Wrobel 1991; Wrobel & Heeschen 1991; Best et al. 2005b; Brown et al. 2011; Sabater et al. 2019) and also the very wide spread of the radio luminosity (several orders of magnitude) at a given host mass. Two-thirds of the detected gETGs are compact, with sizes ≲4 kpc. This confirms the prevalence of compact radio sources in nearby ETGs (Capetti et al. 2017). The radio emission of 46 (24%) gETGs is extended, with sizes up to ∼300 kpc, and at least 80% of these have a Fanaroff & Riley (1974) type I morphology. Based on the morphology and spectral index of the extended sources, we classified ∼30% of them as candidate remnant or restarted sources. Optical spectroscopy (available for 44 gETGs) indicates that the nuclear gas in 7 gETGs is ionized by young stars, which suggests a contribution to their radio emission from star-forming regions. Although all the 25 most luminous (MK < −25.8) gETGs are detected at 150 MHz, they are not all currently turned on: At least 4 of them are remnant sources, and at least one source is likely powered by star formation.
We here extend our analysis to less massive ETGs (mETGs) with −23.5 < MK < −25 in the same redshift range (see below for the details of the sample selection). The selected galaxies lie above the exponential cutoff of the near-infrared luminosity function of local ETGs, which occurs at MK ∼ −22.3 (see, e.g., Bell et al. 2003). ETGs can be separated into two classes based on their surface brightness profile (SBP; Faber et al. 1997; Lauer 2012): The SBPs of Sérsic galaxies (SGs) are well represented by a single Sérsic function (Sersic 1968), while it deviates in core-Sérsic galaxies (CSGs) from a Sérsic law in that the core is partially depleted (Graham et al. 2003; Trujillo et al. 2004; Scott et al. 2013). SGs are less luminous than CSGs. The transition occurs at MK ∼ −24.5 (Capetti & Balmaverde 2006), although the two classes coexist at luminosities −23.5 ≳ MK ≳ −25. Capetti & Balmaverde (2006) found that the radio-loudness of AGN that are hosted by ETGs is univocally related to the brightness profile of the host: CSGs invariably host radio-loud nuclei, while SGs are associated with radio-quiet nuclei. The gETGs are expected to be CSGs based on their luminosity, while the mETGs straddle the luminosity separation between the two classes. Therefore, the sample of ETGs we study in this work covers the crucial mass range in which the transition between SGs and CSGs (and radio-loud/radio-quiet AGN) occurs.
We also consider a sample of even less massive ETGs (lmETGs) with −21.5 < MK < −23.5 in our study. The sample corresponds to a mass range of ∼0.8 × 10¹⁰ − 6 × 10¹⁰ M⊙. The lmETGs are thought to be all SGs based on their near-infrared luminosity.
The properties of radio-AGN are also likely to be affected by the large-scale environment. Best et al. (2007) studied the connection between environment and radio activity in nearby groups (z < 0.1) identified in observations of the Sloan Digital Sky Survey (SDSS, York et al. 2000) by Von Der Linden et al. (2007). They found that brightest group and cluster galaxies (BCGs) are more likely to host a radio-loud AGN than galaxies of the same stellar mass. Within ∼20% of the virial radius, cluster galaxies exhibit an enhanced likelihood of radio-loud AGN activity. Croston et al. (2019) found that only 10% of the radio AGN are located in halos with M > 1014 M⊙. Within this population, they found that the radio luminosity of the brightest AGN depends on the richness, and that the radio luminosity negatively depends on the distance from the cluster center. These results indicate that the nuclear activity is related to the large-scale environment and not to the host stellar mass alone.
Capetti et al. (2020) explored the properties of the large-scale environment of the compact FR 0 radio galaxies associated with nearby (z < 0.05) ETGs. They reported that FR 0s are located in regions with an average galaxy density that was lower by a factor of two than for FR Is. This difference is driven by the large fraction (63%) of FR 0s that are located in groups formed by fewer than 15 galaxies. FR Is rarely (17%) inhabit an environment like this. The authors interpreted the differences in environment between FR 0s and FR Is as due to an evolutionary link between local galaxies density, black hole spin, jet power, and extended radio emission. The analysis of the environment of local ETGs can be used to test these conclusions and strengthen their statistical significance.
The paper is organized as follows: In Sect. 2 we describe the sample of the selected sources and the available radio observations with LOFAR and from surveys at 1.4 GHz. In Sect. 3 we present the main results for the mETGs, including a description of the radio morphology and spectral shape. The connection between radio properties and environment is the subject of Sect. 4. The information available for the mETGs from optical spectroscopy are described in Sect. 5. The analysis is then extended to even lower-mass ETG in Sect. 6, which are used to set our results on a firmer basis. In Sect. 7 we discuss the results, which are summarized in Sect. 8, where we also draw our conclusions.
2. Sample selection and the LOFAR observations
In Paper I we selected the galaxies that are included in the 2MASS Redshift Survey Huchra et al. (2012) by requiring a declination Dec > 0 °, a Hubble type T ≤ 0, a total absolute magnitude MK < −25, and a recession velocity (corrected for the effects of the Virgo cluster, the Great Attractor, and the Shapley supercluster; Mould et al. 2000) v < 7500 km s−1. We here extend the analysis to less massive ETGs by requiring a total absolute magnitude in the −23.5 < MK < −25 range. The magnitude limit of the 2MASS survey, K = 11.75, translates into a threshold in the absolute of MK = −23.45 at v = 7500 km s−1: The selected sources form a complete volume-limited sample. By using the relation between the dynamical mass and K-band absolute magnitude (log M* = 10.58 − 0.44 × (MKs + 23); Cappellari 2013), the mETG masses lie in the range of ∼6 × 10¹⁰ − 3 × 10¹¹ M⊙, while we considered in Paper I all the available LoTSS pointings (including DR1 data and proprietary data). Considering the higher space density of lower-mass ETGs, we can now limit ourselves to the 432 galaxies that are located in the area covered by the second LoTSS data release (DR2; Shimwell et al. 2022) as they form a sufficiently large sample for this statistical study. Furthermore, the DR2 images are deeper than those obtained from individual LoTSS pointings. Two additional sources are superposed to the lobes of bright nearby sources, and they were dropped from the sample at this stage.
In the same DR2 area there are 158 lmETGs. The magnitude limit of the 2MASS survey, K = 11.75, translates into a threshold in the absolute of MK = −23.45 at v = 7500 km s−1: Unlike the gETGs and mETGs, the lmETGs sample is not complete (see Fig. 1 where we present the distribution of the lmETGs in the cz versus absolute magnitude plane).
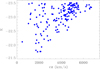 |
Fig. 1. Distribution in the cz vs. absolute magnitude plane of the lmETG sample. The empty region in the bottom right corner is due to the threshold of the 2MASS sample we used for the near-infrared selection of these galaxies. |
Figure 2 shows the distributions in redshift and absolute K-band magnitude of all the ETGs considered in this study. The combined sample of mETGs and gETGs covers a range of a factor ∼100 in near-infrared luminosity.
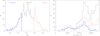 |
Fig. 2. Distributions of absolute K-band magnitude (left) and recession velocity (right) for the three ETG samples. The red histograms show the gETGs studied in Paper I (the dashed histogram in the left panel represents the gETGs included in the LoTSS DR2 area, the same region in which the mETGs and lmETGs were selected), the black histogram shows the mETGs sample, and the blue histogram represents the lmETGs. The lmETG sample is not complete, and this is clearly seen in the reduced number of galaxies below MK > −23.5 and for v ≳ 6000 km s−1. |
The LoTSS DR2 includes 27% of the northern sky with a median rms sensitivity of 83 μJy beam−1. DR2 provides fully calibrated mosaics at a resolution with a full width at half maximum (FWHM) ∼6″, catalogs, and pipeline products. The flux density scale has an accuracy of approximately 10%.
3. The radio properties of mETGs
We estimated the rms of each image of the mETGs in various regions, usually centered 45′ away from the source of interest. The median rms is 88 μJy beam−1, similar to the value measured over the whole DR2. The radio flux density of the sources is available from the released catalog, but several galaxies have large-scale and complex radio structures that are not always fully included in the catalog measurement. For these objects, we measured the flux densities directly from the images and included the whole source emission within the 3σ isophote. We obtained a detection at > 5σ significance for 208 (48%) of the sources of the sample.
The measurements at 1.4 GHz were obtained from the Faint Images of the Radio Sky at Twenty centimeters survey (FIRST; Becker et al. 1995; Helfand et al. 2015) or from the National Radio Astronomy Observatory Very Large Array Sky Survey (NVSS; Condon et al. 1998). The FIRST area contains 219 galaxies, 45 of which are detected by this survey above the 5σ level. For the undetected sources, we estimated upper limits at five times the local noise, typically ∼0.14 mJy beam−1. For the 102 galaxies outside the FIRST area, we collected the NVSS measurements; 37 of these sources have an NVSS detection. For the remaining 65 sources, we adopted a limit of 2 mJy. For the extended galaxies (defined as described in Sect. 3) we measured the NVSS flux densities in the same region as was used for the LOFAR images.
The LOFAR observations did not detect 224 mETGs at a 5σ significance (52%). The corresponding limits to the radio luminosity range from ∼3 × 10¹⁹ to ∼3 × 10²¹ W Hz−1, with a median of 3 × 10²⁰ W Hz−1. The luminosity distribution at 150 MHz of the mETGs covers a wide range in power from ∼4 × 10¹⁹ W Hz−1 to ∼2 × 1024 W Hz−1 and is compared to that obtained for the gETGs in Fig. 3. The mETGs have a lower median power than the gETGs, which extend to a higher radio power.
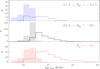 |
Fig. 3. Distribution of the 150 MHz luminosity of the three samples of ETGs: (top) lmETGs, (middle) mETGs, and (bottom) the gETGs studied in Paper I. The dashed histograms correspond to the upper limits of the undetected sources. |
We defined the 31 sources in which the 3σ level isophote extends to a radius of at least 15″(about twice the beam FWHM) as extended objects. Their images are presented in Appendix B. In Fig. 4 we show three examples that are representative of the main morphological classes. The sizes of the extended sources range from 2.2 to 180 kpc, with a median of 12 kpc.
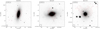 |
Fig. 4. Three examples of mETGs with extended radio emission, representative of the main morphological classes: cospatial radio and optical emission (left), jetted source(center), diffuse radio source (right). The LOFAR images at 150 MHz are superposed to the optical images from Pan-STARRS. The lowest contours are drawn at three times the local rms (see Table A.1). Images of all 31 extended sources are shown in the Appendix B. |
In 5 galaxies with extended radio structures, optical and radio emission are closely cospatial (see Appendix B for a morphological description of the individual sources), and the radio emission is elongated along the same axis as the host galaxy in another 6 cases. This suggests that the radio emission is not produced by an AGN in these 11 galaxies, but is due to processes related to the host, such as free-free emission in star-forming regions and cosmic rays accelerated by supernova explosions (see, e.g., Tabatabaei et al. 2017). Nine sources have an elongated morphology that suggests the presence of jets. The radio emission of four mETGs is instead diffuse and lacks a central component, while one has a ring-like structure. The radio structure of the remaining six sources is unclear because they are barely resolved.
The remaining 177 mETGs are unresolved or marginally resolved. The limit to their sizes is ≲4 kpc. These compact sources represent 85% of the detected sources and 41% of the whole sample. The fraction of detected sources (and of those with extended emission) among the mETGs decreases with decreasing near-infrared host luminosity (see Table 1).
Properties of mETGs versus gETGs.
In Fig. 5 we compare the flux densities at 150 MHz and 1.4 GHz of the radio sources associated with the mETGs. The compact objects show a large spread in their spectral slopes, −0.5 < α150, 1400 < 1.2, with the spectral indices α defined as Fν ∝ ν−α. but the range could be even wider considering the lower limits. Most extended sources have 0.5 < α150, 1400 < 1.0, which is typical of currently active objects. Three of them (namely, NGC 3619, NGC 4148, and NGC 6211) have flatter spectral indices (0.0 < α150, 1400 < 0.5): These are all core-dominated sources, and their spectrum is determined by the (likely flat spectrum) central component.
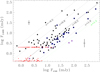 |
Fig. 5. Comparison of the flux densities at 150 and 1400 MHz for the mETGs. The small red dots mark the upper limits for the sources that are not detected at 1.4 GHz. The two clusters of upper limits correspond to the sources that are undetected by either the FIRST or the NVSS. The two black crosses represent the typical errors on the flux density measurements, which are ∼10% on F150 and ∼30% and ∼5% for high and low values of F1400, respectively. The blue diamonds mark the extended sources at 150 MHz. The lines represent the loci of constant spectral index. |
In Paper I we defined as candidate remnant and restarted sources (RRS) those with (1) a bright small-scale radio structure accompanied by large-scale diffuse emission (restarted sources) or (2) a radio spectral index α150, 1400 > 1.2 and lack of a central component (remnant sources). Using the same definition, we find in the sample of mETGs one candidate restarted source, CGCG499-084. Its radio emission is dominated by two diffuse tails extending over ∼180 kpc and by a central compact bright region. The overall spectral index is α150, 1400 = 1.14, suggesting that the radio tails are remnants of a previous phase of activity. The limits to the radio spectral index for two extended sources (namely, CGCG 311-017 and NGC 7276) are α150, 1400 > 1.34 and α150, 1400 > 1.35, respectively, and we consider them as candidate remnant sources. Three more extended sources are not detected at 1.4 GHz either (namely, NGC 2521, UGC 1022, and UGC 1503). The lower limits to their spectral slopes are in the α150, 1400 > 0.54 − 0.96 range, which means that they are not necessarily remnant sources. However, they are all characterized by a diffuse radio structure, which supports this interpretation. Overall, we set an upper limit of ≲16% to the fraction of RRSs among the mETGs with extended radio emission and of ≲1% for the whole sample.
In Fig. 6 we compare the near-infrared and radio luminosity of the mETGs and gETGs. The radio power shows a spread of about four orders of magnitude at a given host luminosity. We estimated the median luminosity,  , of the mETGs by splitting the sample into three bins of absolute magnitude, each 0.5 mag wide, and by using the stacking technique (e.g., White et al. 2007). By performing a filtering of the images of the three subsamples in the luminosity domain, we measured the values of
  reported in Table 1. The median L150 increases with stellar luminosity. A linear fit, estimated using the Python procedure polyfit, to the median L150 in the four brightest bins of MK (i.e., also including the gETGs) returns log L150 = ( − 0.96 ± 0.02)×(MK + 25.5)+(21.79 ± 0.01). The faintest galaxies show an excess with respect to the general trend. In particular, the measured median luminosity for the galaxies with −23.5 < MK < −24.0 is log L150 = 20.58 ± 0.04. This value is higher by a factor of about three than the extrapolation of the correlation, which predicts log L150 = 20.10 ± 0.03.
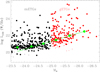 |
Fig. 6. Absolute K-band magnitude vs. the luminosity at 150 MHz. The red symbols show the gETGs (MK < −25.0), and the black symbols show the mETGs (−25.0 < MK < −23.5). The small dots mark the upper limits of the undetected objects. The large green dots represent the median radio luminosity in six bins of absolute magnitude, and the green line is the best linear fit to the four brightest galaxies bins. |
Figure 7 reports the fraction of ETGs hosting a radio source with a power higher than a given radio power in various bins of near-infrared absolute magnitude. These functions are fully determined down to the luminosity at which we encounter the first upper limit. Below this value, the presence of undetected sources produces two branches that represent the lower and upper envelope of the true distribution. This analysis can be extended to lower luminosities with the stacking technique, which enables us to estimate the median power of the undetected sources. We find a power of log L150 = 20.57 at the 81th percentile, log L150 = 20.34 at the 71th percentile, and log L150 = 20.12 at the 71th percentile for the three luminosity bins of the mETGs. Overall, this analysis confirms that the more massive galaxies have a higher probability to host a radio luminosity above a given threshold. However, this trend is not seen at the lowest near-infrared luminosities because the mETGs in the two lower-luminosity bins show very similar distributions. This is clearly seen in Fig. 8, where we compare the distributions of the 150 MHz luminosity of the least massive mETGs. In addition, the slopes of the distributions generally increase with decreasing LK. This effect is likely due to the cutoff in the power law that describes these distributions, which occur at a radio power that moves to lower L150 for lower LK.
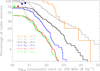 |
Fig. 7. Fraction of galaxies that host a radio source above a given luminosity limit. The samples of mETGs and gETGs are split into six bins with a K-band luminosity that are 0.5 mag wide. The galaxies in the first bin have −23.5 > MK > −24.0 (green histogram), and the following bins correspond to the red, blue, black, gray, and orange histograms. The solid histograms correspond to the detected sources, and the dashed histograms include the upper limits and represent the lower and upper envelope of the distribution, respectively. The circles represent the median value of the undetected sources obtained with the stacking technique. |
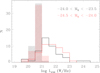 |
Fig. 8. Comparison of the distributions of the 150 MHz luminosity of the mETGs in the two least massive bins. The dashed histograms represent the upper limits for the undetected sources. |
4. Large-scale environment and radio activity in mETGs and gETGs
We explored the connection between the large-scale environment and the radio properties of both ETG samples. We used the galaxy group catalog built from the 2MASS Redshift Survey by Tully (2015) to identify those associated with each ETG of our sample. We report the number of group members from Tully (2015), Nmb, for each galaxy in Tables A.1 and C.1. Figure 9 shows the distributions of Nmb for the gETGs and the mETGs, considering extended, compact, and undetected sources separately.
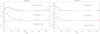 |
Fig. 9. Comparison of the number of group members, Nmb, for the gETGs (left) and mETGs (right). In each subsample, we separately consider the sources based on their radio properties. The 34 mETGs with Nmb > 65 (22 undetected, 10 compact, and 2 extended), all belonging to the Coma cluster, are not shown for more clarity. Similarly, there are 9 gETGs with Nmb > 65 (3 undetected, 5 compact, and one extended). |
The radio morphology and Nmb in gETGs are strongly connected. The median Nmb value for the extended sources is  , for the compact sources, it is
  , and for the undetected sources, it is
  . The Kolmogorov-Smirnov test indicates that the Nmb distributions for the three subsamples are all significantly different. The Kolmogorov-Smirnov test returns a probability of P = 0.042 when the extended and the compact sources are compared, P = 5 × 10⁻⁵ for the comparison between extended and undetected sources, and P = 0.013 for the compact and the unresolved sources. For the mETGs, the median value for all classes is
  , and their distributions are not statistically different at a 5% confidence level.
Capetti et al. (2020) compared the large-scale environment of the compact FR 0 radio galaxies with those with a FR I morphology. They found that FR 0s are located in a poorer environment, 63% of them living in groups formed by less than 15 galaxies, compared to only 17% of the FR Is. Their analysis is based on the number of cosmological neighbors,  , i.e., galaxies lying within a region of projected radius of 1 Mpc and having a spectroscopic redshift differing by less than 0.005 from the radio galaxy, based on SDSS data.
The gETGs sample is only partially covered by the SDSS survey and this method cannot be applied. To put the present result into context we estimated  and Nmb for the 78 gETGs with available SDSS spectra. The number of companions estimated by the two methods shows a strong correlation, with
  , the larger number of cosmological neighbors being due to the fact that the SDSS data reach lower magnitudes with respect to 2MASS.
After applying a factor two correction to the galaxy members of each system, following the aforementioned analysis, we find that the fractions of gETGs located in 2MASS groups with less than eight members are 28% and 53% for the extended and compact sources, respectively, in substantial agreement with the previous analysis.
The link between the radio morphology of the gETGs and large-scale galaxy densities translates into a similar connection between radio luminosity and environment, likely due to the fact that the extended sources are generally those of higher radio power. The median luminosities at 150 MHz are 4.2 × 10²⁰, 12.6 × 10²⁰, and 19.5 × 10²⁰ W Hz−1, for galaxies with Nmb ≤ 10, 10 < Nmb ≤ 30, and Nmb > 30, respectively.
Furthermore, the galaxy densities around compact sources is higher than in undetected ones. For the compact gETGs we find a median  while the stacking analysis indicates that this value for the undetected sources is 5.1 × 10²⁰ W Hz−1. This effect does not stem from the dependence on the host luminosity, because these two classes have very similar median values (
 and
and  for the compact and undetected sources, respectively). These results indicate that the large scale environment plays an important role in setting the morphology and the luminosity of the radio sources associated with ETGs.
As already mentioned, these results apply only to the gETGs. No link between environment and radio properties is seen for the mETGs.
5. Optical spectroscopic properties of mETGs
Optical spectra can be used to identify the gas ionization mechanism by measuring the ratios of selected emission lines (e.g. Heckman 1980; Baldwin et al. 1981; Veilleux & Osterbrock 1987; Kewley et al. 2006). We used the fluxes of the diagnostic optical emission lines from the MPA-JHU added value catalog of SDSS spectral measurements1 SDSS spectra are available for 158 of the ETGs of our sample, but only in 73 of these spectra it is possible to measure a sufficient number of emission lines (at a significance > 5σ) to locate them in the diagnostic diagrams, see Fig. 10. Their spectral classification is reported in Table A.1. Three ETGs in the [O III]/Hβ versus [S II]/Hα diagram fall into the region of Seyferts, and 45 of them are among the LINERs. The remaining 25 (34 %) are compatible with a classification as star-forming (S.F.).
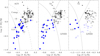 |
Fig. 10. Optical spectroscopic diagnostic diagrams for the mETGs with available SDSS spectra. We adopted a conservative threshold of S/N > 5 for the lines detection. The solid lines are from Kewley et al. (2006) and separate S.F. galaxies, LINER, and Seyfert; in the first panel, the region between the two curves is populated by the composite galaxies. Triangles are used to mark upper or lower limits. The blue symbols represent mETGs located within the region populated by S.F. galaxies in the [S II]/Hα vs. [O III]/Hβ diagram. |
The 25 S.F. candidates span the whole range of near-infrared luminosity with a median of MK = −24.0, which is slightly lower than the median for the whole sample. Most S.F. candidates (20 out of 25) are detected by LOFAR with luminosities in the range L150 = 1.7 × 10²¹ − 6 × 10²² W Hz−1 (median L150 = 5 × 10²¹ Hz−1). All but two (MCG+10-12-141 and UGC 09473) are compact sources.
By adopting the relation from Gürkan et al. (2018), we translated the radio luminosities at 150 MHz of the S.F. candidates detected by LOFAR into a star formation rate (SFR). We obtained a range between 0.2 and 4.3 M⊙ yr−1 (median 0.4 M⊙ yr−1).
The masses of the 25 S.F. candidates are in the range of ∼6 × 10¹⁰ − 2 × 10¹¹ M⊙. The values for the specific SFR (sSFR) are 0.6 − 30 × 10−12 yr−1. The median value (including the sources not detected at 150 MHz) is 2.5 × 10⁻¹² yr−1.
From the point of view of the radio spectra, only eight of the S.F. candidates are detected in the surveys at 1.4 GHz, and the resulting spectral slopes are in the range of  , with a median of
  that is consistent with the low-frequency radio slope of S.F. galaxies (α = 0.59, Klein et al. 2018).
6. Extending the study to lower-mass ETGs
The results of the previous sections show several trends linking the radio properties to the host luminosity. In particular, we found an increase in median radio luminosity with the host mass. While this trend in the brightest galaxies is well described by  , the L150 versus LK flattens in the faintest galaxies. However, this effect is not well defined. It is only visible in the −24.5 < MK < −23.5 luminosity range. The lmETGs sample can be used to place this result on a stronger basis.
The luminosity distribution at 150 MHz of the 55 detected lmETGs covers a wide range in power, from ∼3 × 10¹⁹ W Hz−1 to ∼1023 W Hz−1 (see Fig. 3). One hundred and three lmETGs are not detected by the LOFAR observations, and the median limit to their radio luminosities is 2.5 × 10²⁰ W Hz−1. The fraction of detected lmETGs is smaller than that measured in the samples of more massive ETGs. It is 35%, 48%, and 78% for the lmETGs, mETG, and gETGs, respectively. We list the main properties of the lmETG sample in Table D.1.
In Fig. 11 we compare the near-infrared and radio luminosity of the three samples. As we found for the more massive ETGs, the radio power of lmETGs is spread widely (about four orders of magnitude) at a given host luminosity. By including the lmETGs, we confirm that the median radio luminosity decreases at lower stellar luminosity. We estimated the median luminosity,  , of the lmETGs by splitting the sample into four bins of absolute magnitude, each 0.5 mag wide, and using the stacking technique. The stacking analysis only returns a robust measurement for the two bins including the brightest galaxies. We obtained log
  and 20.12 for −22.5 > MK > −23.0 and −23.0 > MK > −23.5, respectively. Similarly to the lower-mass mETGs, the lmETGs show an excess with respect to the trend measured at the highest masses. The overall connection between L150 and near-infrared luminosity LK is well described by log
  for MK ≲ −24.5, while it flattens to a slope of 1.03 for the four bins including the less luminous ETGs. From a linear fit, we obtain log L150 = ( − 0.41 ± 0.04)×(MK + 23.5)+(20.41 ± 0.04).
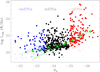 |
Fig. 11. Absolute K-band magnitude vs. luminosity at 150 MHz. The red symbols are the gETGs (MK < −25.0), the black symbols are the mETGs (−25.0 < MK < −23.5), and the blue symbols are the lmETGs (−23.5 < MK < −21.5). The small dots mark the upper limits of the undetected objects. The large green dots represent the median radio luminosity in eight bins of absolute magnitude, and the solid (dashed) green line represents the best linear fit to the four brightest (faintest) galaxies bins. |
Another effect shown by the ETGs is the dependence of the morphology of the radio sources on the host mass. In this respect, the morphologies of the radio sources associated with the lmETGs are significantly different from those seen in the brighter ETGs. In the gETGs, we found 42 (out of 188) extended sources, at least 80% of which having a class I Fanaroff & Riley (1974) morphology. The fraction of sources with a jetted morphology in mETGs is strongly reduced. Only nine out of 432 galaxies (∼2%) are jetted, while the morphology of none of the lmETGs is indicative of collimated jets. Only 4 (out of 158) lmETGs satisfy the definition of an extended radio source. In all four cases, the radio emission is diffuse and cospatial with the host galaxy.
While most radio sources in the gETGs and mETGs are compact or barely resolved, the most common morphology in lmETGs is a diffuse emission. To draw a more quantitative comparison, we show in Fig. 12 the distribution of the radio source extension (obtained by fitting a two-dimensional Gaussian profile as reported in the DR2 catalog) versus the flux density at 150 MHz for the lmETGs and the mETGs split into two bins of absolute magnitude. Overall, there is a clear trend of increasing radio source size for lower-mass ETGs. More quantitatively, 51% of the lmETGs have measured angular sizes between ∼10″ and ∼25″, corresponding to deconvolved linear sizes of ∼4 − 12 kpc. Conversely, for the two luminosity bins of mETGs, the fractions are 36% and 14%.
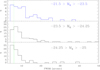 |
Fig. 12. Distribution of the radio sources extension vs. flux density at 150 MHz for the lmETGs (top) and the mETGs, split into two bins of near-infrared luminosity (middle and bottom). The dashed green lines mark the 6″ resolution of the LoTSS images. |
7. Discussion
The study of a volume-limited sample of ETGs covering a factor ∼100 in host luminosity indicates that several physical parameters show a positive correlation with the stellar luminosity.
(1) The fraction of galaxies detected by LOFAR increases with increasing LK: While the more luminous gETGs (with −26.0 < MK < −26.5) are all detected at 150 MHz, this fraction decreases to ∼40% for the least luminous mETGs and to 35% for lmETGs.
(2) The fraction of extended radio sources decreases from 45% in the more massive gETGs to 6% in the less massive mETGs. While the extended sources in gETGs have a median size of 57 kpc, this value is 12 kpc in the mETGs. At least 80% of the extended gETGs have a FR I class morphology, which clearly indicates jets. Only 9 mETGs (∼2%) are likely jetted sources, six of which lie in the brightest host luminosity bin. The radio emission is cospatial (or aligned) with the optical emission in 11 mETGs, suggesting a prevalence of processes at the origin of the radio emission related to the host galaxies. None of the lmETGs has a morphology indicative of the presence of collimated jets. Only 4 (out of 158) lmETGs satisfy the definition of an extended radio source, and in all cases, the radio emission is diffuse and cospatial with the host galaxy.
(3) The median radio luminosity shows an increasing trend with the host luminosity. When only the brightest galaxies are considered, this trend is well described by  . The faintest galaxies instead show a much shallower, almost linear, dependence on LK. This is interpreted as due to the transition from an AGN- to host-dominated radio emission.
(4) The fraction of candidate RRSs among the gETGs is ∼7%. This is ∼28% of those with extended emission. Conversely, we find only one candidate restarted source among the mETGs and two sources with a spectral index higher than 1.2, which are therefore candidate remnants. Three additional extended sources that are not detected at 1.4 GHz might be remnant sources. This interpretation is supported by their diffuse morphology. However, the limits to their spectral slopes are all well below the 1.2 threshold. Overall, we set an upper limit of ≲1% to the fraction of RRSs in the mETG sample, which is ≲16% of those with extended emission. This is lower than in gETGs. However, when we only consider the mETGs with a jetted morphology, this fraction increases significantly.
(5) The source radio morphology and the large-scale environment of gETGs are connected. The extended (and more powerful radio sources) are found in regions of higher galaxy density than the compact and undetected sources. This effect is absent for the mETGs.
To summarize, the median radio power, the fraction of the detected sources, and the fraction (and size) of the jetted sources all depend on the host luminosity. The fraction of RRS is also related to the host mass because it decreases from ∼7% in the gETGs to < 1% in the mETGs. These same parameters are also related to the large-scale environment: We find a connection between the large-scale galaxy density and the presence of extended radio emission and its luminosity. This effect is seen only in the gETGs and in the most massive mETGs. However, these results only describe statistical trends. Even when we consider sources of similar stellar mass and environment, for example, a wide spread in radio luminosity is found. This implies that additional physical quantities such as the accretion rate and the source age are likely to be involved in setting the level of radio activity. In addition, as we already argued in Paper I, compact and extended radio sources differ in their jet properties. The compact sources might be produced by slower jets because of a lower black holes spin.
These trends break at the lowest near-infrared luminosity. While at high mass, the L150 versus LK relation is well described by a power law with an index of ∼2.6, at lower masses, the index decreases to ∼1. In addition, while the more massive ETGs are mostly associated with point-like or jetted radio sources, in the least luminous galaxies, these are often diffuse and extended on a scale of ∼4 − 12 kpc. These results suggest that in the less massive galaxies probed by our study, the dominant process at the origin of the radio emission is not associated with a radio-loud AGN, but with the host galaxy. This interpretation is supported by the significant fraction of mETGs and lmETGs in which the radio emission is aligned (or cospatial) with the host galaxy. In these sources, the radio emission is likely to be dominated by processes related to the host galaxies such as young stars and supernovae. The fraction of mETGs in which the optical spectra indicate that the nuclear gas is ionized by young stars is ∼16%, similar to what we found for the gETGs. The star formation rate, which is derived by ascribing the radio emission to young stars, is similar for two luminosity classes of ETGs, but the specific SFR is about three times higher in mETGs than in gETGs because their mass is lower. However, the SDSS spectra cover a nuclear region of less than 1 kpc in radius, and they are not representative of the whole galaxy. The only two sources where the extended emission is cospatial (or aligned) with the host and with an available SDSS spectra are one Seyfert and one LINER. This suggests that the radio emission in low-mass ETGs might also be powered by a radio-quiet AGN.
The transition between radio sources that are dominated by a radio-loud AGN to host galaxy processes (or radio-quiet AGN) occurs at a mass that is similar to the mass at which ETGs change their stellar brightness profile from a pure Sérsic law to a core-Sérsic law. As already mentioned in the Introduction, the different brightness profiles correspond to the dichotomy between radio-loud and radio-quiet AGN: Radio-loud AGN are only hosted by core galaxies, while radio-quiet AGN are found only in Sérsic galaxies.
8. Summary and conclusions
We explored the radio properties of ETGs in the local Universe (recession velocity < 7500 km s−1) as seen by LOFAR observations at 150 MHz. In Paper I we considered 188 giant ETGs with MK < −25, while here we analyzed the mETGs, which have a near-infrared luminosity in the −23.5 > MK > −25 range, that is, with a mass 6 × 10¹⁰ ≲ M* ≲ 3 × 10¹¹ M⊙. We also considered even less luminous galaxies, the lmETGs, down to MK = −21.5. The combined volume-limited sample covers an interval of a factor ∼100 in stellar mass.
The fraction of sources detected above a typical luminosity of ∼3 × 10²⁰W Hz−1 decreases from 78% of the gETGs to ∼48% of the mETGs and ∼35% of the lmETGs. Of the 31 mETGs with a radio emission that extends over at least 15″, only a minority (9, representing ∼2% of the whole sample) have a morphology suggesting the presence of collimated jets. This fraction is ∼20% for the gETGs. No jetted source is found among the lmETGs. Although we observed mETGs with extended radio emission (with a median size of ∼12 kpc), the majority of them (∼85% of the detected sources) is unresolved, with a characteristic limit to their size of ∼4 kpc. This strengthen previous results that compact FR 0 radio sources represent the dominant population of radio galaxies in the nearby Universe.
Our study confirms the strong connection between the radio properties and the host mass: (1) the positive correlation between the stellar luminosity and the median radio power, (2) the fraction of compact sources that increases with decreasing host mass, (3) the high incidence of jetted sources among the most massive ETGs (about 20%), and their scarcity (∼2%) among the least massive ones.
However, the trends above break for the least luminous ETGs. The extension of the study to even less massive ETGs, the lmETGs, which reach masses as low as ∼0.8 × 10¹⁰ M⊙, shows that while at high mass, the log L150 ∼ log LK relation is well described by a power law with an index of ∼2.6, at lower masses, the index decreases to ∼1. Combined with the radio morphology of the less massive ETGs, which is often aligned with the optical axis, this result suggests that we are observing the transition from the population of the most massive ETGs, M* ≳ 2 × 10¹¹ M⊙, in which the dominant process of radio emission can be associated with a radio loud AGN, to host-dominated sources. At approximately this mass, the stellar surface brightness profile also transitions from Sérsic galaxies to those with a depleted stellar core. Previous studies have shown that only core galaxies host radio-loud AGN. This is in line with the present analysis.
The selection of a complete sample based only on stellar luminosity is optimally suited to exploring the duty cycle of the radio activity in ETGs. We are now in the position to further constrain the energy output of radio-loud AGN. The mETGs showing extended radio emission include a candidate restarted source, with a bright central region associated with two low-brightness tails, and two galaxies are characterized by a steep radio spectral index ( ) that are likely remnant sources. Three additional extended sources have a diffuse morphology: They are not detected in the surveys at 1.4 GHz and should be considered candidate remnant sources. Overall, by considering the mETGs and gETGs samples, based on a combination of morphology an spectral index, we isolated 19 restarted and remnant (or candidate remnant) sources. With multiband radio observations, we will be able to estimate the timescale of the various activity phases.
Available at http://www.mpa-garching.mpg.de/SDSS/DR7/
Acknowledgments
M.B. acknowledges financial support from the agreement ASI-INAF n. 2017-14-H.O, from the PRIN MIUR 2017PH3WAT “Blackout” and from the ERC-Stg “MAGCOW”, no. 714196. LOFAR, the Low Frequency Array designed and constructed by ASTRON, has facilities in several countries, which are owned by various parties (each with their own funding sources), and are collectively operated by the International LOFAR Telescope (ILT) foundation under a joint scientific policy. The ILT resources have benefited from the following recent major funding sources: CNRS-INSU, Observatoire de Paris and Université d’Orléans, France; BMBF, MIWF-NRW, MPG, Germany; Science Foundation Ireland (SFI), Department of Business, Enterprise and Innovation (DBEI), Ireland; NWO, The Netherlands; the Science and Technology Facilities Council, UK; Ministry of Science and Higher Education, Poland; The Istituto Nazionale di Astrofisica (INAF), Italy. Part of this work was carried out on the Dutch national e-infrastructure with the support of the SURF Cooperative through grant e-infra 160022 and 160152. The LOFAR software and dedicated reduction packages on https://github.com/apmechev/GRID_LRT were deployed on the e-infrastructure by the LOFAR e-infragrop, consisting of J. B. R. (ASTRON and Leiden Observatory), A. P. Mechev (Leiden Observatory) and T. Shimwell (ASTRON) with support from N. Danezi (SURFsara) and C. Schrijvers (SURFsara). The Jülich LOFAR Long Term Archive and the German LOFAR network are both coordinated and operated by the Jülich Supercomputing Centre (JSC), and computing resources on the supercomputer JUWELS at JSC were provided by the Gauss Centre for supercomputing e.V. (grant CHTB00) through the John von Neumann Institute for Computing (NIC). This research made use of the University of Hertfordshire high-performance computing facility and the LOFAR-UK computing facility located at the University of Hertfordshire and supported by STFC (ST/P000096/1), and of the Italian LOFAR IT computing infrastructure supported and operated by INAF, and by the Physics Department of Turin University (under an agreement with Consorzio Interuniversitario per la Fisica Spaziale) at the C3S Supercomputing Centre, Italy. The Pan-STARRS1 Surveys (PS1) and the PS1 public science archive have been made possible through contributions by the Institute for Astronomy, the University of Hawaii, the Pan-STARRS Project Office, the Max-Planck Society and its participating institutes, the Max Planck Institute for Astronomy, Heidelberg and the Max Planck Institute for Extraterrestrial Physics, Garching, The Johns Hopkins University, Durham University, the University of Edinburgh, the Queen’s University Belfast, the Harvard-Smithsonian Center for Astrophysics, the Las Cumbres Observatory Global Telescope Network Incorporated, the National Central University of Taiwan, the Space Telescope Science Institute, the National Aeronautics and Space Administration under Grant No. NNX08AR22G issued through the Planetary Science Division of the NASA Science Mission Directorate, the National Science Foundation Grant No. AST-1238877, the University of Maryland, Eotvos Lorand University (ELTE), the Los Alamos National Laboratory, and the Gordon and Betty Moore Foundation.
References
- Baldi, R. D., Chiaberge, M., Capetti, A., et al. 2010, ApJ, 725, 2426 [NASA ADS] [CrossRef] [Google Scholar]
- Baldi, R. D., Capetti, A., & Giovannini, G. 2015, A&A, 576, A38 [NASA ADS] [CrossRef] [EDP Sciences] [Google Scholar]
- Baldwin, J. A., Phillips, M. M., & Terlevich, R. 1981, PASP, 93, 5 [Google Scholar]
- Becker, R. H., White, R. L., & Helfand, D. J. 1995, ApJ, 450, 559 [Google Scholar]
- Bell, E. F., McIntosh, D. H., Katz, N., & Weinberg, M. D. 2003, ApJS, 149, 289 [Google Scholar]
- Best, P. N., Kauffmann, G., Heckman, T. M., & Ivezić, Ž. 2005a, MNRAS, 362, 9} [Google Scholar]
- Best, P. N., Kauffmann, G., Heckman, T. M., et al. 2005b, MNRAS, 362, 25 [Google Scholar]
- Best, P. N., von der Linden, A., Kauffmann, G., Heckman, T. M., & Kaiser, C. R. 2007, MNRAS, 379, 894 [Google Scholar]
- Brown, M. J. I., Jannuzi, B. T., Floyd, D. J. E., & Mould, J. R. 2011, ApJ, 731, L41} [Google Scholar]
- Capetti, A., & Balmaverde, B. 2006, A&A, 453, 27 [NASA ADS] [CrossRef] [EDP Sciences] [Google Scholar]
- Capetti, A., Massaro, F., & Baldi, R. D. 2017, A&A, 598, A49 [NASA ADS] [CrossRef] [EDP Sciences] [Google Scholar]
- Capetti, A., Massaro, F., & Baldi, R. D. 2020, A&A, 633, A161 [NASA ADS] [CrossRef] [EDP Sciences] [Google Scholar]
- Capetti, A., Brienza, M., Balmaverde, B., et al. 2022, A&A, 660, A93 [NASA ADS] [CrossRef] [EDP Sciences] [Google Scholar]
- Cappellari, M. 2013, ApJ, 778, L2 [NASA ADS] [CrossRef] [Google Scholar]
- Chiaberge, M., & Marconi, A. 2011, MNRAS, 416, 917 [Google Scholar]
- Colla, G., Fanti, C., Fanti, R., et al. 1975, A&AS, 20, 1 [NASA ADS] [Google Scholar]
- Condon, J. J., Cotton, W. D., Greisen, E. W., et al. 1998, AJ, 115, 1693 [Google Scholar]
- Croston, J. H., Hardcastle, M. J., Mingo, B., et al. 2019, A&A, 622, A10 [NASA ADS] [CrossRef] [EDP Sciences] [Google Scholar]
- Croton, D. J., Springel, V., White, S. D. M., et al. 2006, MNRAS, 365, 11 [Google Scholar]
- Faber, S. M., Tremaine, S., Ajhar, E. A., et al. 1997, AJ, 114, 1771 [NASA ADS] [CrossRef] [Google Scholar]
- Fabian, A. C. 2012, ARA&A, 50, 455 [Google Scholar]
- Fanaroff, B. L., & Riley, J. M. 1974, MNRAS, 167, 31P [Google Scholar]
- Fanti, R., Gioia, I., Lari, C., & Ulrich, M. H. 1978, A&AS, 34, 341 [NASA ADS] [Google Scholar]
- Graham, A. W., Erwin, P., Trujillo, I., & Asensio Ramos, A. 2003, AJ, 125, 2951 [CrossRef] [Google Scholar]
- Gürkan, G., Hardcastle, M. J., Smith, D. J. B., et al. 2018, MNRAS, 475, 3010 [Google Scholar]
- Hardcastle, M. J., Williams, W. L., Best, P. N., et al. 2019, A&A, 622, A12 [NASA ADS] [CrossRef] [EDP Sciences] [Google Scholar]
- Heckman, T. M. 1980, A&A, 87, 152 [Google Scholar]
- Helfand, D. J., White, R. L., & Becker, R. H. 2015, ApJ, 801, 26 [NASA ADS] [CrossRef] [Google Scholar]
- Huchra, J. P., Macri, L. M., Masters, K. L., et al. 2012, ApJS, 199, 26 [Google Scholar]
- Kewley, L. J., Groves, B., Kauffmann, G., & Heckman, T. 2006, MNRAS, 372, 961 [Google Scholar]
- Klein, U., Lisenfeld, U., & Verley, S. 2018, A&A, 611, A55 [NASA ADS] [CrossRef] [EDP Sciences] [Google Scholar]
- Lauer, T. R. 2012, ApJ, 759, 64 [NASA ADS] [CrossRef] [Google Scholar]
- Ledlow, M. J., & Owen, F. N. 1996, AJ, 112, 9 [Google Scholar]
- Mingo, B., Croston, J. H., Hardcastle, M. J., et al. 2019, MNRAS, 488, 2701 [NASA ADS] [CrossRef] [Google Scholar]
- Mingo, B., Croston, J. H., Best, P. N., et al. 2022, MNRAS, 511, 3250 [NASA ADS] [CrossRef] [Google Scholar]
- Miraghaei, H., & Best, P. N. 2017, MNRAS, 466, 4346 [NASA ADS] [Google Scholar]
- Mould, J. R., Huchra, J. P., Freedman, W. L., et al. 2000, ApJ, 529, 786 [Google Scholar]
- Sabater, J., Best, P. N., Hardcastle, M. J., et al. 2019, A&A, 622, A17 [NASA ADS] [CrossRef] [EDP Sciences] [Google Scholar]
- Sadler, E. M., Jenkins, C. R., & Kotanyi, C. G. 1989, MNRAS, 240, 591 [NASA ADS] [Google Scholar]
- Scott, N., Graham, A. W., & Schombert, J. 2013, ApJ, 768, 76 [NASA ADS] [CrossRef] [Google Scholar]
- Sersic, J. L. 1968, Atlas de Galaxias Australes (Cordoba, Argentina: Observatorio Astronomico) [Google Scholar]
- Shimwell, T. W., Röttgering, H. J. A., Best, P. N., et al. 2017, A&A, 598, A104 [NASA ADS] [CrossRef] [EDP Sciences] [Google Scholar]
- Shimwell, T. W., Hardcastle, M. J., Tasse, C., et al. 2022, A&A, 659, A1 [NASA ADS] [CrossRef] [EDP Sciences] [Google Scholar]
- Tabatabaei, F. S., Schinnerer, E., Krause, M., et al. 2017, ApJ, 836, 185 [Google Scholar]
- Trujillo, I., Erwin, P., Asensio Ramos, A., & Graham, A. W. 2004, AJ, 127, 1917 [NASA ADS] [CrossRef] [Google Scholar]
- Tully, R. B. 2015, AJ, 149, 171 [NASA ADS] [CrossRef] [Google Scholar]
- Veilleux, S., & Osterbrock, D. E. 1987, ApJS, 63, 295 [Google Scholar]
- Von Der Linden, A., Best, P. N., Kauffmann, G., & White, S. D. M. 2007, MNRAS, 379, 867 [Google Scholar]
- White, R. L., Helfand, D. J., Becker, R. H., Glikman, E., & de Vries, W. 2007, ApJ, 654, 99 [Google Scholar]
- Wrobel, J. M. 1991, AJ, 101, 127 [NASA ADS] [CrossRef] [Google Scholar]
- Wrobel, J. M., & Heeschen, D. S. 1991, AJ, 101, 148 [Google Scholar]
- York, D. G., Adelman, J., Anderson, J. E., Jr, et al. 2000, AJ, 120, 1579 [Google Scholar]
Appendix A: Properties of the mETG sample
Radio properties of the sample
Appendix B: Images and notes on the radio morphology of the extended sources
We present here the images and a description of the properties of the 31 mETGs with extended radio emission, that is, those in which the 3σ level isophote extends to a radius of at least 15″(about twice the beam FWHM).
CGCG 499-084. Two diffuse tails of emission, extending for ∼ 180 kpc, are suggestive of the presence of jets. This source has a rather steep spectral slope ( = 1.14), and we consider it candidate restarted source.
CGCG 536-006. Radio emission aligned with the optical axis.
UGC 00724. Diffuse and elongated emission.
UGC 01022. Diffuse source. Possible remnant.
NGC 0670. Cospatial radio and optical emission.
UGC 01503. Ring-like structure. Possible remnant source.
UGC 01590. Possible one-sided jet.
UGC 04085. Radio emission aligned with the optical axis.
CGCG 147-020. Possible two-sided jetted source.
NGC 2521. Diffuse radio structure. Possible remnant source.
MCG +10-12-141. Unclear radio structure.
CGCG 311-017. Diffuse radio source with a steep spectral index (α150, 1400 > 1.34): We consider it candidate remnant source.
NGC 2830. Cospatial radio and optical emission.
CGCG 312-008. Radio emission aligned with the optical axis.
NGC 3207. Two-sided jetted source.
NGC 3415. Cospatial radio and optical emission.
UGC 06013. Cospatial radio and optical emission.
NGC 3619. Four nearby galaxies cause the radio emission to appear extended.
NGC 3945. Possible two-sided jetted source.
NGC 3998. Two-sided jetted source.
NGC 4148. The central emission has a double structure, with the secondary compact source cospatial with a fainter galaxy located ∼12″ north. The extended lobes appear to originate from this secondary radio galaxy.
NGC 4849. Possible two-sided jetted source.
NGC 4869. Narrow-angle tail jetted source.
NGC 5225. Unclear radio structure.
NGC 5361. Cospatial radio and optical emission.
UGC 09473. Unclear radio structure.
NGC 6211. Possible one-sided jetted source.
CGCG 513-017. Radio emission aligned with the optical axis.
NGC 7276. Diffuse radio source with a steep spectral index (α150, 1400 > 1.35): We consider it candidate remnant source.
UGC 12655. Radio emission aligned with the optical axis.
NGC 7836. Radio emission aligned with the optical axis.
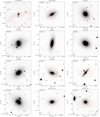 |
Fig. B.1. LOFAR images at 150 MHz of the 31 galaxies showing extended emission. The lowest contour is drawn at three times the local r.m.s., as reported in Table A.1. |
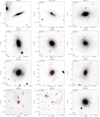 |
Fig. B.1. continued. |
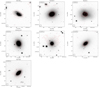 |
Fig. B.1. continued. |
Appendix C: Environment of the gETG sample.
Number of group members for the gETGs.
Appendix D: Properties of the lmETG sample
Radio properties of the lmETG sample
All Tables
All Figures
|
Fig. 1. Distribution in the cz vs. absolute magnitude plane of the lmETG sample. The empty region in the bottom right corner is due to the threshold of the 2MASS sample we used for the near-infrared selection of these galaxies. |
| In the text | |
|
Fig. 2. Distributions of absolute K-band magnitude (left) and recession velocity (right) for the three ETG samples. The red histograms show the gETGs studied in Paper I (the dashed histogram in the left panel represents the gETGs included in the LoTSS DR2 area, the same region in which the mETGs and lmETGs were selected), the black histogram shows the mETGs sample, and the blue histogram represents the lmETGs. The lmETG sample is not complete, and this is clearly seen in the reduced number of galaxies below MK > −23.5 and for v ≳ 6000 km s−1. |
| In the text | |
|
Fig. 3. Distribution of the 150 MHz luminosity of the three samples of ETGs: (top) lmETGs, (middle) mETGs, and (bottom) the gETGs studied in Paper I. The dashed histograms correspond to the upper limits of the undetected sources. |
| In the text | |
|
Fig. 4. Three examples of mETGs with extended radio emission, representative of the main morphological classes: cospatial radio and optical emission (left), jetted source(center), diffuse radio source (right). The LOFAR images at 150 MHz are superposed to the optical images from Pan-STARRS. The lowest contours are drawn at three times the local rms (see Table A.1). Images of all 31 extended sources are shown in the Appendix B. |
| In the text | |
|
Fig. 5. Comparison of the flux densities at 150 and 1400 MHz for the mETGs. The small red dots mark the upper limits for the sources that are not detected at 1.4 GHz. The two clusters of upper limits correspond to the sources that are undetected by either the FIRST or the NVSS. The two black crosses represent the typical errors on the flux density measurements, which are ∼10% on F150 and ∼30% and ∼5% for high and low values of F1400, respectively. The blue diamonds mark the extended sources at 150 MHz. The lines represent the loci of constant spectral index. |
| In the text | |
|
Fig. 6. Absolute K-band magnitude vs. the luminosity at 150 MHz. The red symbols show the gETGs (MK < −25.0), and the black symbols show the mETGs (−25.0 < MK < −23.5). The small dots mark the upper limits of the undetected objects. The large green dots represent the median radio luminosity in six bins of absolute magnitude, and the green line is the best linear fit to the four brightest galaxies bins. |
| In the text | |
|
Fig. 7. Fraction of galaxies that host a radio source above a given luminosity limit. The samples of mETGs and gETGs are split into six bins with a K-band luminosity that are 0.5 mag wide. The galaxies in the first bin have −23.5 > MK > −24.0 (green histogram), and the following bins correspond to the red, blue, black, gray, and orange histograms. The solid histograms correspond to the detected sources, and the dashed histograms include the upper limits and represent the lower and upper envelope of the distribution, respectively. The circles represent the median value of the undetected sources obtained with the stacking technique. |
| In the text | |
|
Fig. 8. Comparison of the distributions of the 150 MHz luminosity of the mETGs in the two least massive bins. The dashed histograms represent the upper limits for the undetected sources. |
| In the text | |
|
Fig. 9. Comparison of the number of group members, Nmb, for the gETGs (left) and mETGs (right). In each subsample, we separately consider the sources based on their radio properties. The 34 mETGs with Nmb > 65 (22 undetected, 10 compact, and 2 extended), all belonging to the Coma cluster, are not shown for more clarity. Similarly, there are 9 gETGs with Nmb > 65 (3 undetected, 5 compact, and one extended). |
| In the text | |
|
Fig. 10. Optical spectroscopic diagnostic diagrams for the mETGs with available SDSS spectra. We adopted a conservative threshold of S/N > 5 for the lines detection. The solid lines are from Kewley et al. (2006) and separate S.F. galaxies, LINER, and Seyfert; in the first panel, the region between the two curves is populated by the composite galaxies. Triangles are used to mark upper or lower limits. The blue symbols represent mETGs located within the region populated by S.F. galaxies in the [S II]/Hα vs. [O III]/Hβ diagram. |
| In the text | |
|
Fig. 11. Absolute K-band magnitude vs. luminosity at 150 MHz. The red symbols are the gETGs (MK < −25.0), the black symbols are the mETGs (−25.0 < MK < −23.5), and the blue symbols are the lmETGs (−23.5 < MK < −21.5). The small dots mark the upper limits of the undetected objects. The large green dots represent the median radio luminosity in eight bins of absolute magnitude, and the solid (dashed) green line represents the best linear fit to the four brightest (faintest) galaxies bins. |
| In the text | |
|
Fig. 12. Distribution of the radio sources extension vs. flux density at 150 MHz for the lmETGs (top) and the mETGs, split into two bins of near-infrared luminosity (middle and bottom). The dashed green lines mark the 6″ resolution of the LoTSS images. |
| In the text | |
|
Fig. B.1. LOFAR images at 150 MHz of the 31 galaxies showing extended emission. The lowest contour is drawn at three times the local r.m.s., as reported in Table A.1. |
| In the text | |
|
Fig. B.1. continued. |
| In the text | |
|
Fig. B.1. continued. |
| In the text | |
Current usage metrics show cumulative count of Article Views (full-text article views including HTML views, PDF and ePub downloads, according to the available data) and Abstracts Views on Vision4Press platform.
Data correspond to usage on the plateform after 2015. The current usage metrics is available 48-96 hours after online publication and is updated daily on week days.
Initial download of the metrics may take a while.