Open Access
Fig. B.1.
Download original image
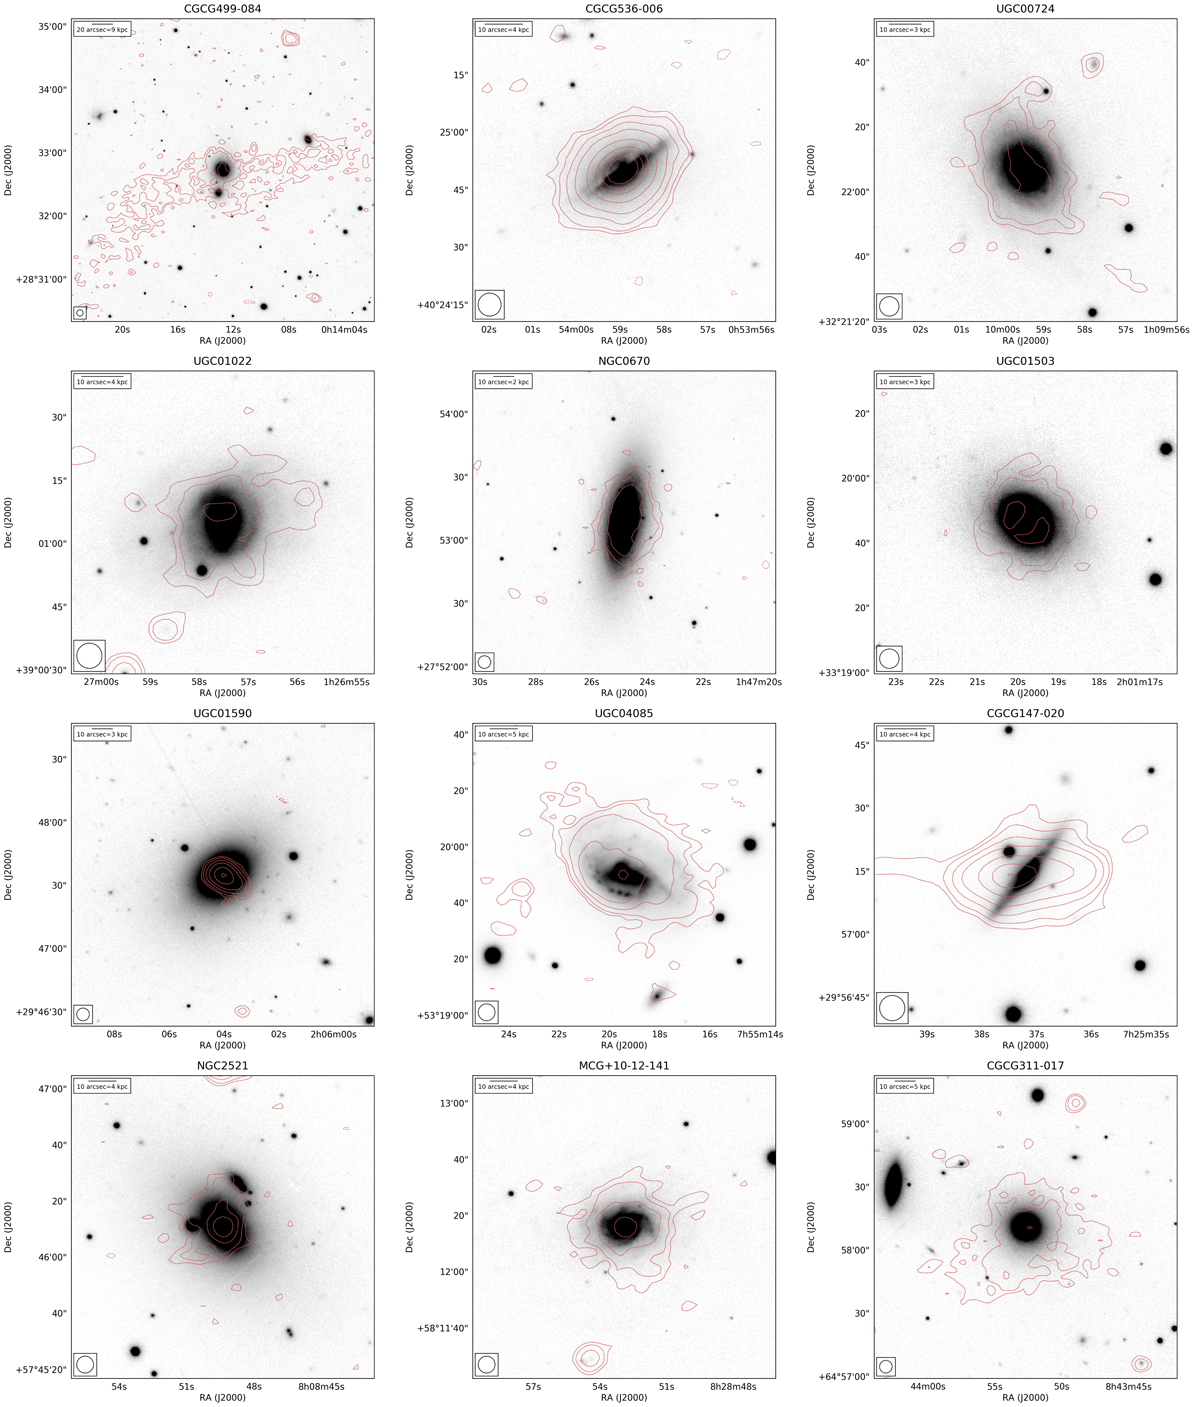
LOFAR images at 150 MHz of the 31 galaxies showing extended emission. The lowest contour is drawn at three times the local r.m.s., as reported in Table A.1.
Current usage metrics show cumulative count of Article Views (full-text article views including HTML views, PDF and ePub downloads, according to the available data) and Abstracts Views on Vision4Press platform.
Data correspond to usage on the plateform after 2015. The current usage metrics is available 48-96 hours after online publication and is updated daily on week days.
Initial download of the metrics may take a while.