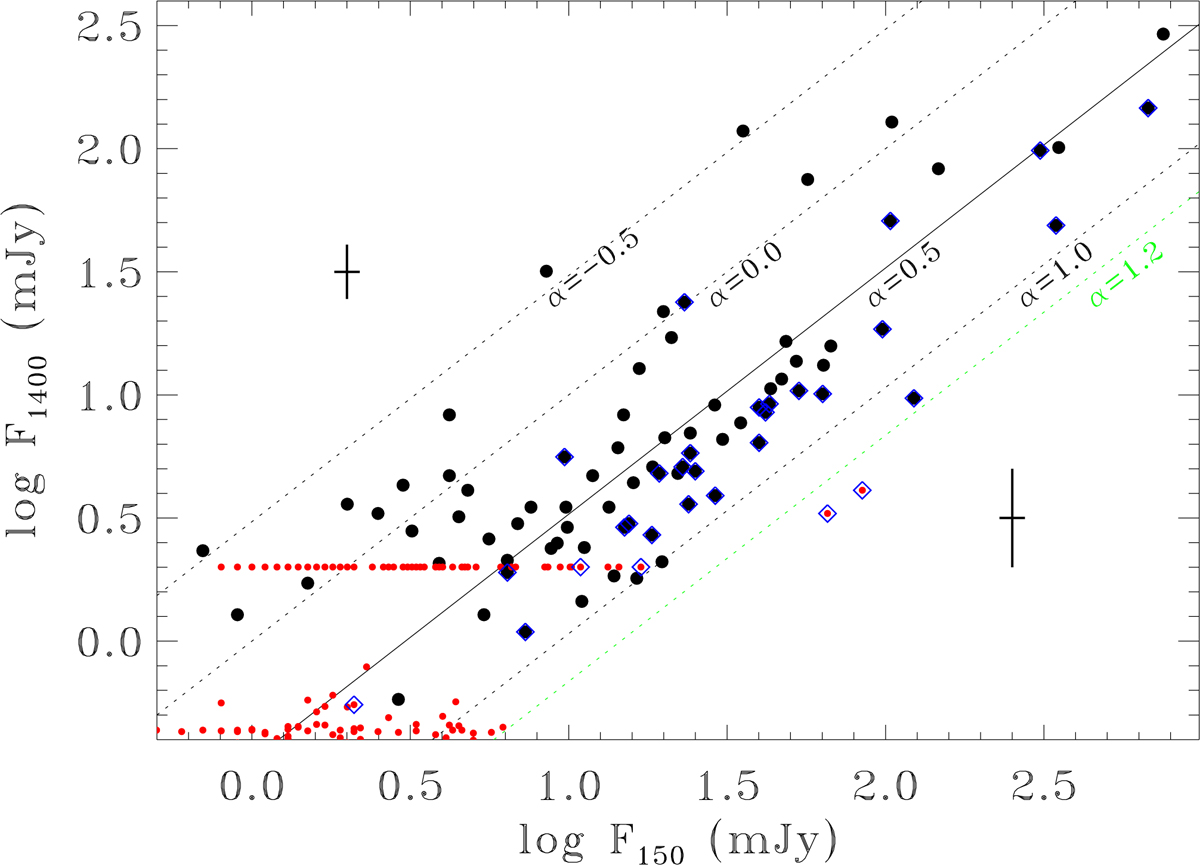
Fig. 5.
Download original image
Comparison of the flux densities at 150 and 1400 MHz for the mETGs. The small red dots mark the upper limits for the sources that are not detected at 1.4 GHz. The two clusters of upper limits correspond to the sources that are undetected by either the FIRST or the NVSS. The two black crosses represent the typical errors on the flux density measurements, which are ∼10% on F150 and ∼30% and ∼5% for high and low values of F1400, respectively. The blue diamonds mark the extended sources at 150 MHz. The lines represent the loci of constant spectral index.
Current usage metrics show cumulative count of Article Views (full-text article views including HTML views, PDF and ePub downloads, according to the available data) and Abstracts Views on Vision4Press platform.
Data correspond to usage on the plateform after 2015. The current usage metrics is available 48-96 hours after online publication and is updated daily on week days.
Initial download of the metrics may take a while.