Fig. 2.
Download original image
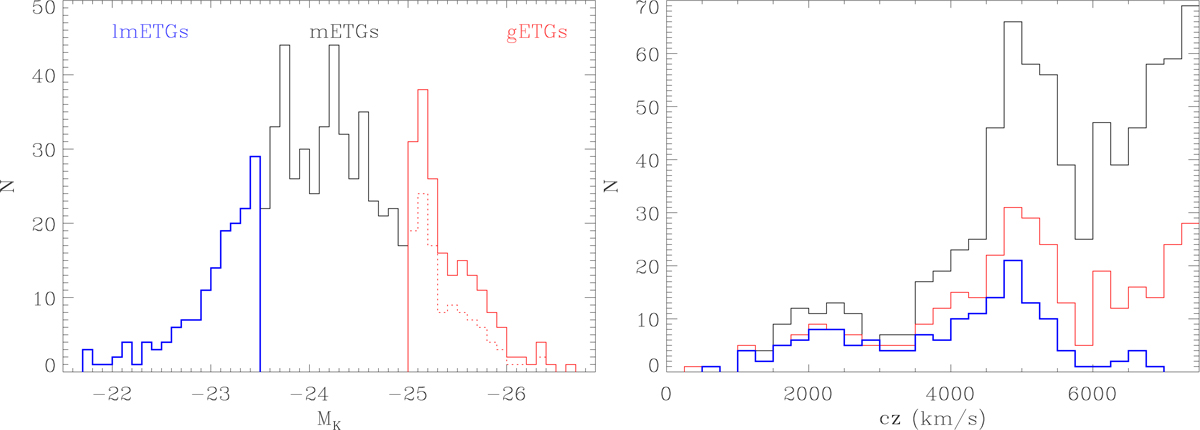
Distributions of absolute K-band magnitude (left) and recession velocity (right) for the three ETG samples. The red histograms show the gETGs studied in Paper I (the dashed histogram in the left panel represents the gETGs included in the LoTSS DR2 area, the same region in which the mETGs and lmETGs were selected), the black histogram shows the mETGs sample, and the blue histogram represents the lmETGs. The lmETG sample is not complete, and this is clearly seen in the reduced number of galaxies below MK > −23.5 and for v ≳ 6000 km s−1.
Current usage metrics show cumulative count of Article Views (full-text article views including HTML views, PDF and ePub downloads, according to the available data) and Abstracts Views on Vision4Press platform.
Data correspond to usage on the plateform after 2015. The current usage metrics is available 48-96 hours after online publication and is updated daily on week days.
Initial download of the metrics may take a while.