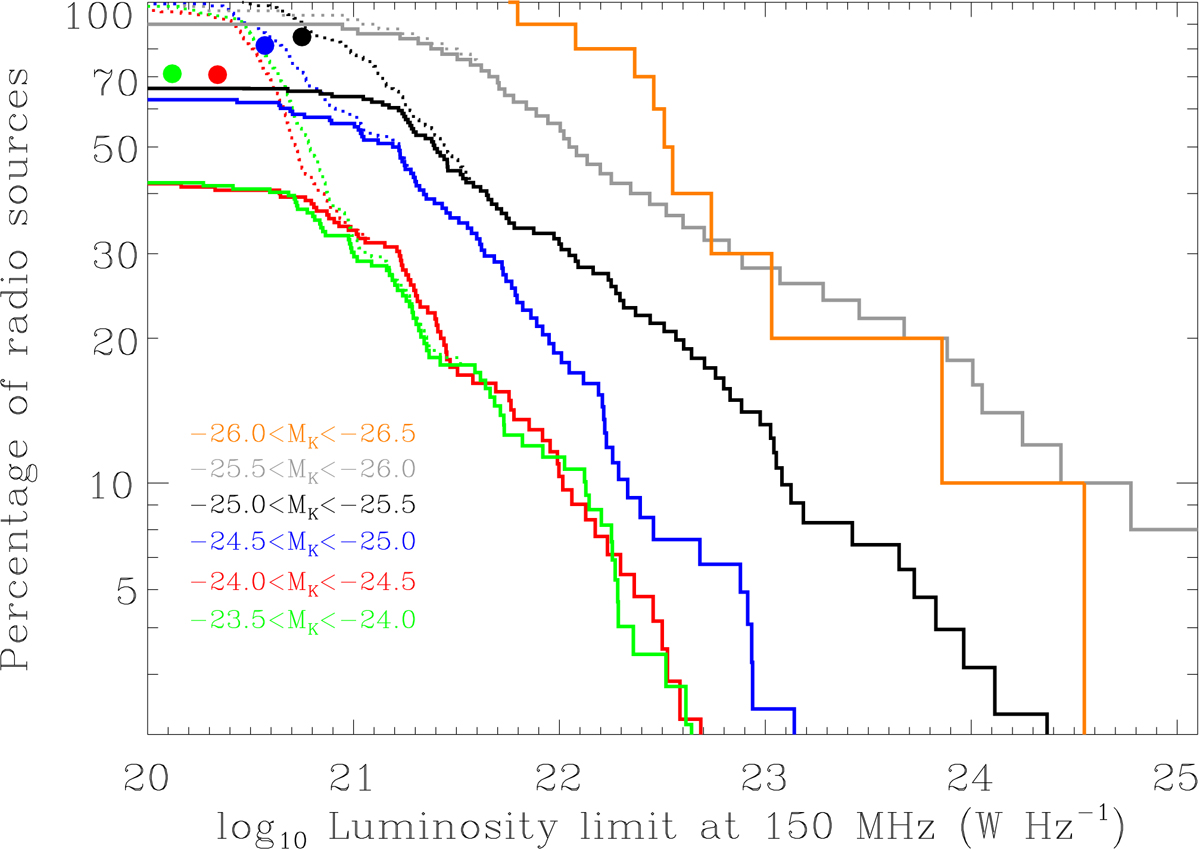
Fig. 7.
Download original image
Fraction of galaxies that host a radio source above a given luminosity limit. The samples of mETGs and gETGs are split into six bins with a K-band luminosity that are 0.5 mag wide. The galaxies in the first bin have −23.5 > MK > −24.0 (green histogram), and the following bins correspond to the red, blue, black, gray, and orange histograms. The solid histograms correspond to the detected sources, and the dashed histograms include the upper limits and represent the lower and upper envelope of the distribution, respectively. The circles represent the median value of the undetected sources obtained with the stacking technique.
Current usage metrics show cumulative count of Article Views (full-text article views including HTML views, PDF and ePub downloads, according to the available data) and Abstracts Views on Vision4Press platform.
Data correspond to usage on the plateform after 2015. The current usage metrics is available 48-96 hours after online publication and is updated daily on week days.
Initial download of the metrics may take a while.