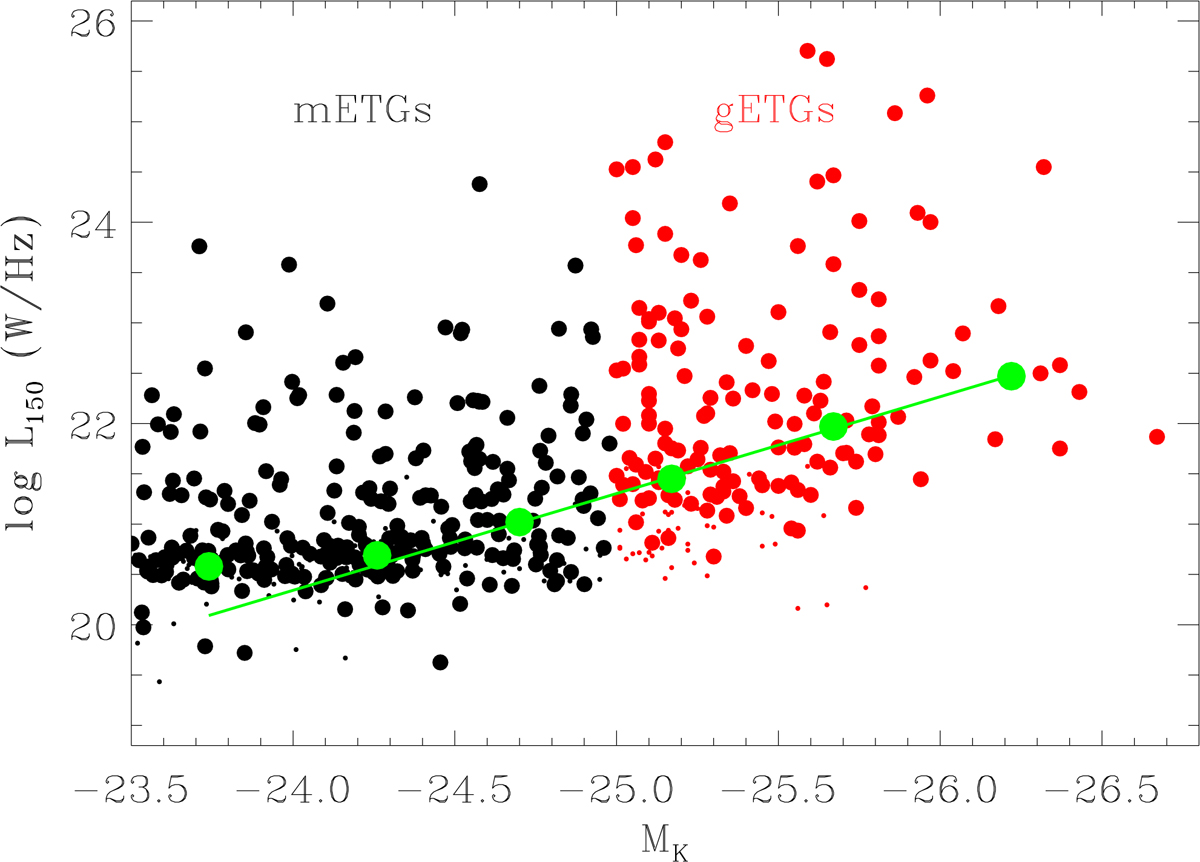
Fig. 6.
Download original image
Absolute K-band magnitude vs. the luminosity at 150 MHz. The red symbols show the gETGs (MK < −25.0), and the black symbols show the mETGs (−25.0 < MK < −23.5). The small dots mark the upper limits of the undetected objects. The large green dots represent the median radio luminosity in six bins of absolute magnitude, and the green line is the best linear fit to the four brightest galaxies bins.
Current usage metrics show cumulative count of Article Views (full-text article views including HTML views, PDF and ePub downloads, according to the available data) and Abstracts Views on Vision4Press platform.
Data correspond to usage on the plateform after 2015. The current usage metrics is available 48-96 hours after online publication and is updated daily on week days.
Initial download of the metrics may take a while.