Free Access
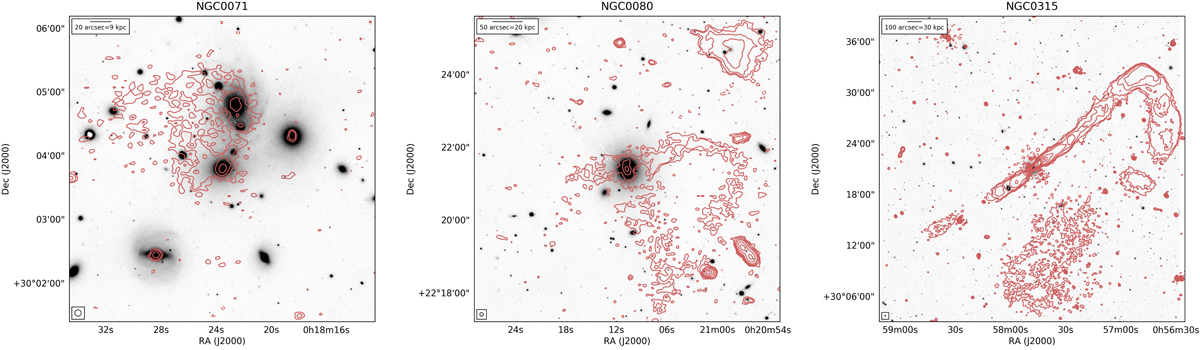
Fig. 3.
Download original image
Three examples of LOFAR images at 150 MHz with extended emission superposed to the optical images from Pan-STARRS. Images of all extended sources are shown in the Appendix B. The lowest contour is drawn at three times the local rms, as reported in Table A.1. The following contours increase with a common ratio of 2.
Current usage metrics show cumulative count of Article Views (full-text article views including HTML views, PDF and ePub downloads, according to the available data) and Abstracts Views on Vision4Press platform.
Data correspond to usage on the plateform after 2015. The current usage metrics is available 48-96 hours after online publication and is updated daily on week days.
Initial download of the metrics may take a while.