Fig. 6.
Download original image
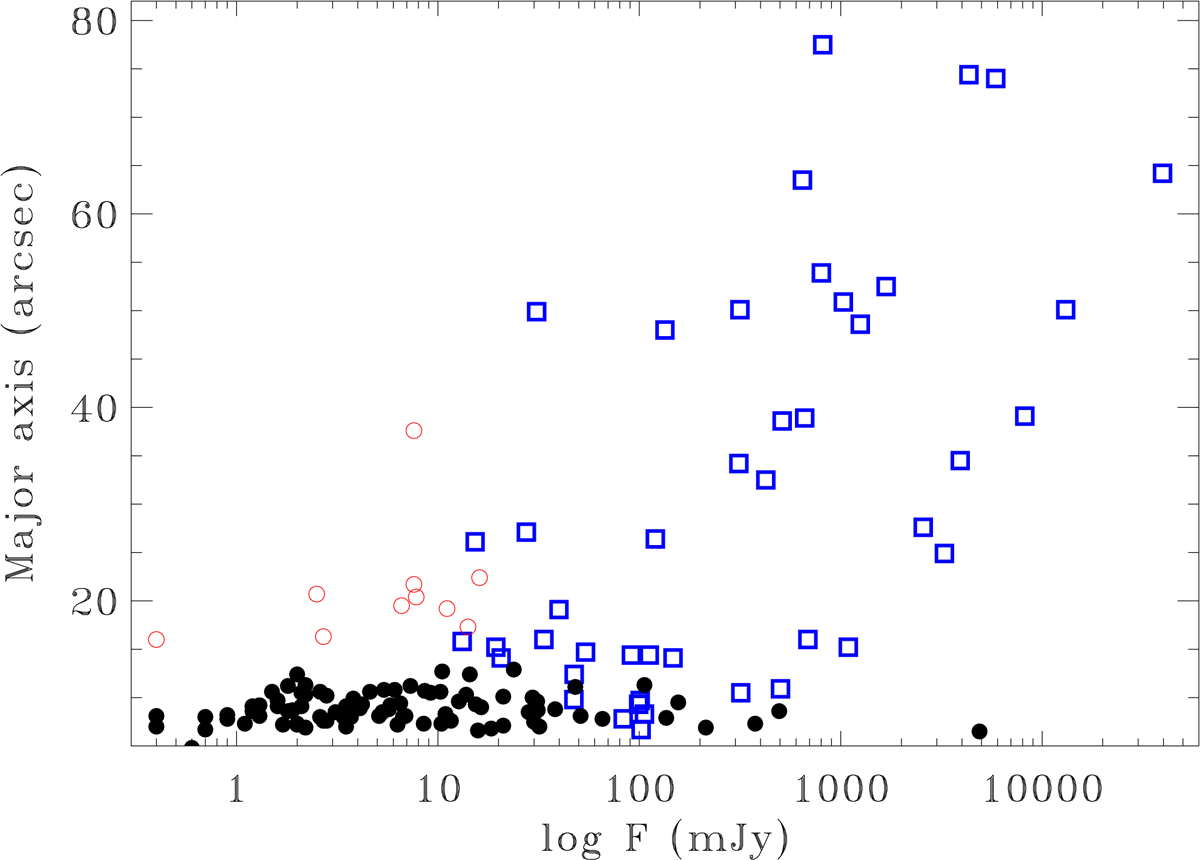
Major axis length of the central component, obtained through Gaussian fitting, versus flux density. The extended sources are marked as empty blue squares, the black dots are those with a full width at half maximum (FWHM) < 15″. The empty red circles are the low-brightness objects, that is, ones whose 3σ level contours do not reach a radius of 15″ but whose FWHM exceeds 15″.
Current usage metrics show cumulative count of Article Views (full-text article views including HTML views, PDF and ePub downloads, according to the available data) and Abstracts Views on Vision4Press platform.
Data correspond to usage on the plateform after 2015. The current usage metrics is available 48-96 hours after online publication and is updated daily on week days.
Initial download of the metrics may take a while.