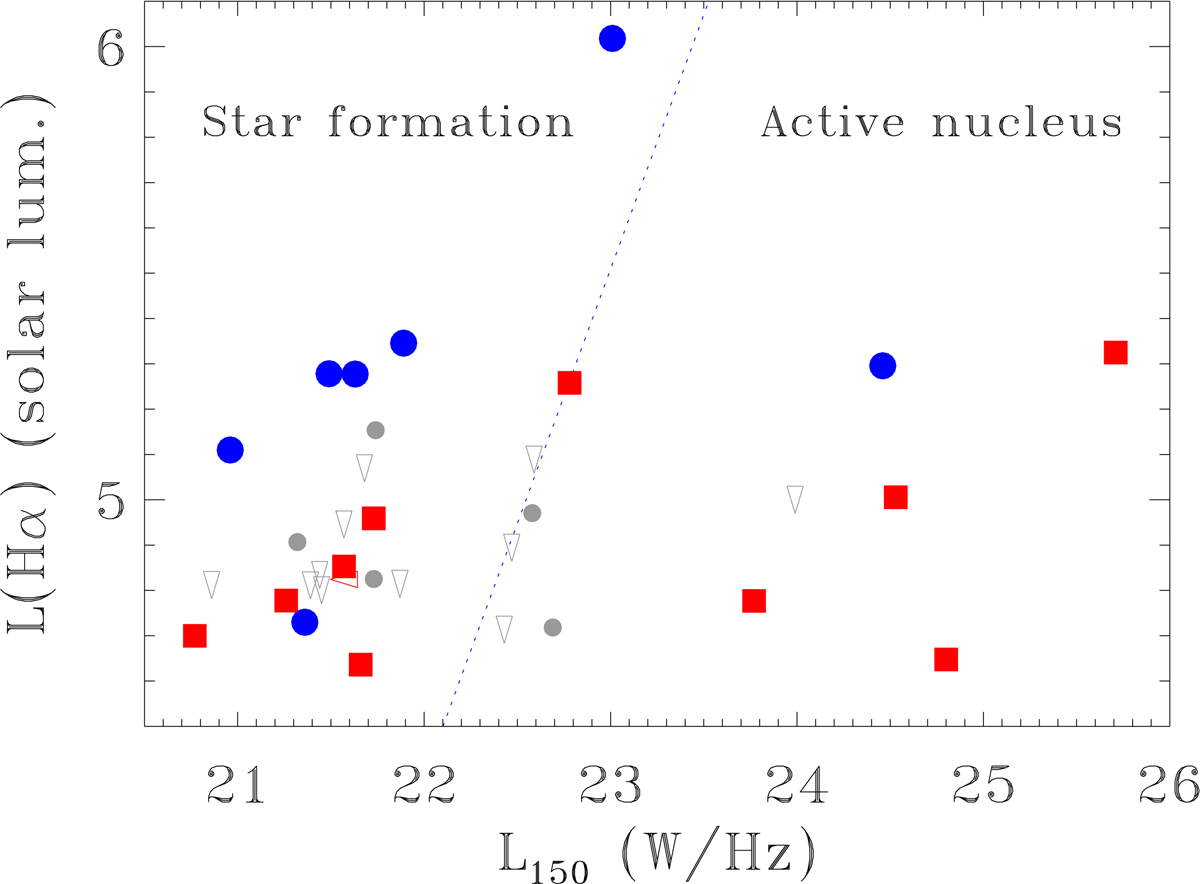
Fig. 13.
Download original image
Comparison of radio and Hα luminosities for the gETGs with available SDSS spectra. The diagonal line marks the empirical separation derived by Best & Heckman (2012) between sources in which the radio emission is dominated by star forming regions (to the left) from those in which it is powered by an AGN (to the right). The blue circles correspond to the sources located in the region of star forming galaxies in Fig. 12, the red squares are those located in the LINERs region, the gray ones are those for which no optical spectral classification is possible, the gray downward pointing triangles are upper limits.
Current usage metrics show cumulative count of Article Views (full-text article views including HTML views, PDF and ePub downloads, according to the available data) and Abstracts Views on Vision4Press platform.
Data correspond to usage on the plateform after 2015. The current usage metrics is available 48-96 hours after online publication and is updated daily on week days.
Initial download of the metrics may take a while.