Fig. 10.
Download original image
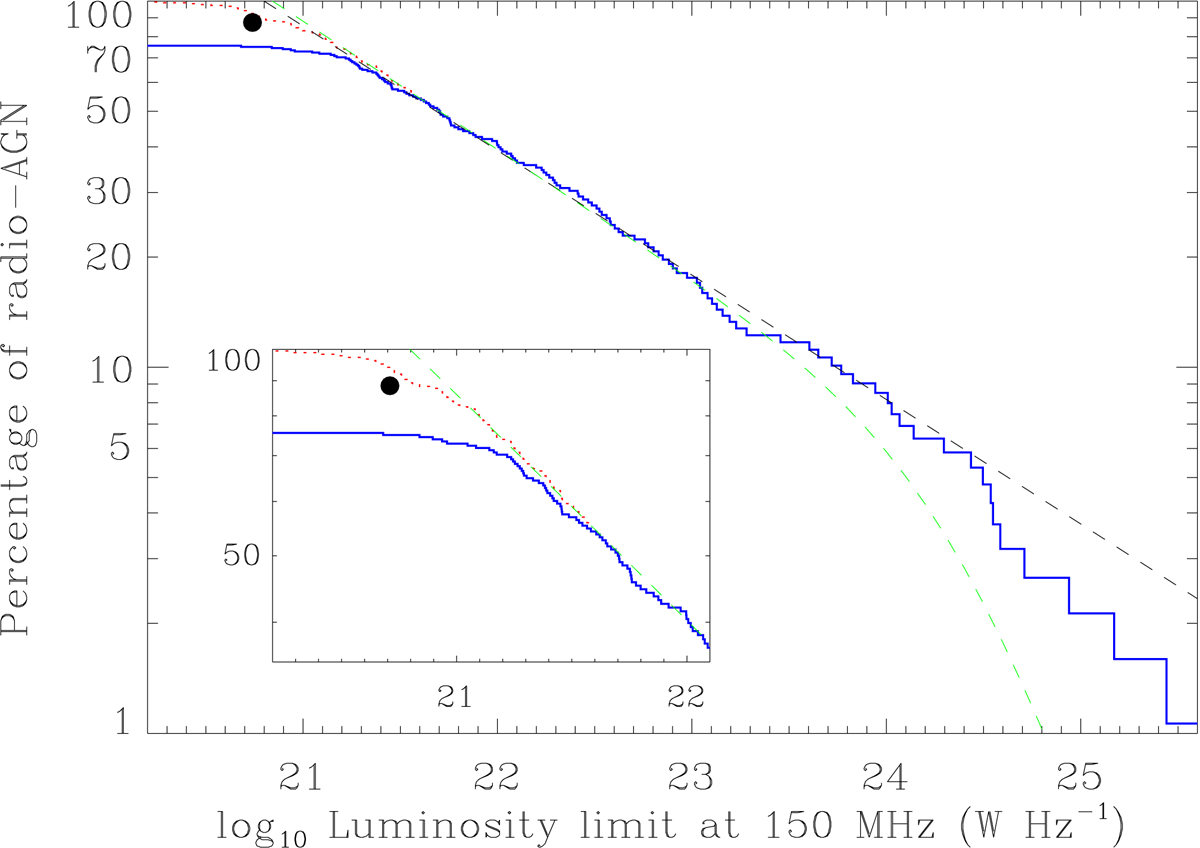
Fraction of galaxies that host a radio source above a given luminosity limit. The blue curve corresponds to the detected sources, the red curve includes the upper limits and represents the upper envelope of the distribution. The black dot represents the result of the stacking of the 42 undetected galaxies. The black dashed line is a power law with a slope of 0.34. The green dashed line is instead the fit obtained by Best et al. (2005b). The inset shows a zoomed-in look at the lowest luminosities.
Current usage metrics show cumulative count of Article Views (full-text article views including HTML views, PDF and ePub downloads, according to the available data) and Abstracts Views on Vision4Press platform.
Data correspond to usage on the plateform after 2015. The current usage metrics is available 48-96 hours after online publication and is updated daily on week days.
Initial download of the metrics may take a while.