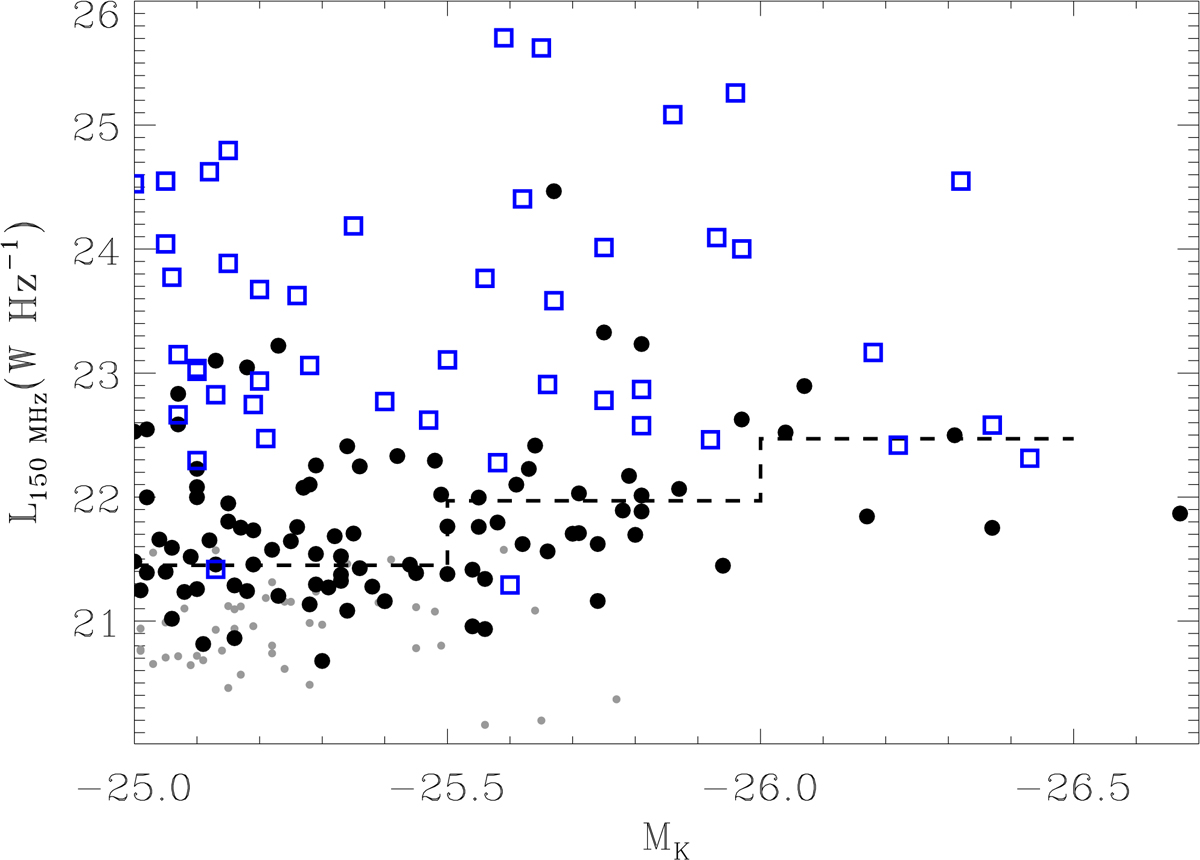
Fig. 9.
Download original image
Comparison between absolute K-band magnitude and the luminosity at 150 MHz. The gETGs show a positive link between the stellar luminosity and median radio power but with a very large spread. The blue squares are the extended sources, the black circles the unresolved ones, and the small gray dots are the undetected objects. The dashed histogram represents the median radio luminosity in three bins of absolute magnitude.
Current usage metrics show cumulative count of Article Views (full-text article views including HTML views, PDF and ePub downloads, according to the available data) and Abstracts Views on Vision4Press platform.
Data correspond to usage on the plateform after 2015. The current usage metrics is available 48-96 hours after online publication and is updated daily on week days.
Initial download of the metrics may take a while.