Free Access
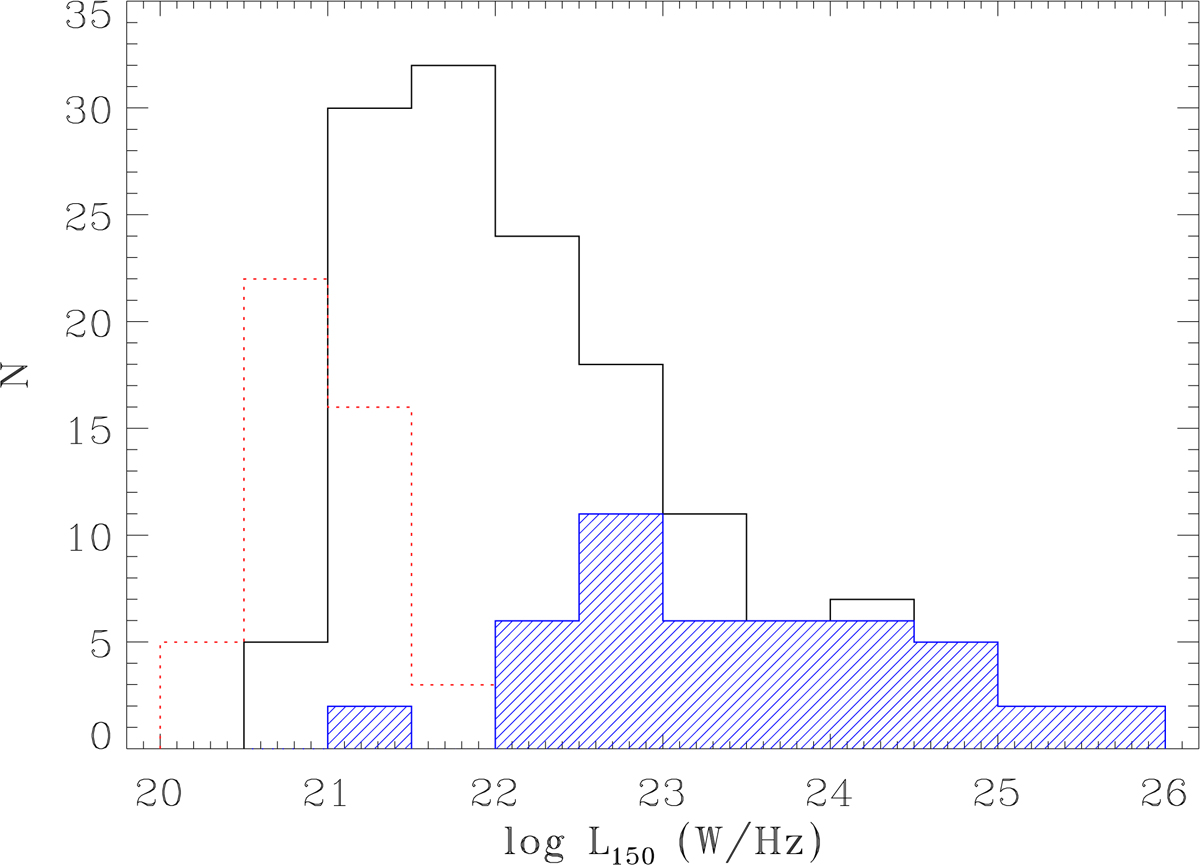
Fig. 2.
Download original image
Distribution of 150 MHz luminosity of the gETGs sample. The blue histogram represents the contribution of the 46 extended sources, the dominant population at high luminosities, while the red dotted histogram corresponds to the upper limits of the undetected sources.
Current usage metrics show cumulative count of Article Views (full-text article views including HTML views, PDF and ePub downloads, according to the available data) and Abstracts Views on Vision4Press platform.
Data correspond to usage on the plateform after 2015. The current usage metrics is available 48-96 hours after online publication and is updated daily on week days.
Initial download of the metrics may take a while.