| Issue |
A&A
Volume 659, March 2022
|
|
|---|---|---|
| Article Number | A177 | |
| Number of page(s) | 8 | |
| Section | Stellar structure and evolution | |
| DOI | https://doi.org/10.1051/0004-6361/202142833 | |
| Published online | 25 March 2022 | |
V456 Cyg: An eclipsing binary with tidally perturbed g-mode pulsations
1
Institute of Astronomy, KU Leuven, Celestijnenlaan 200D, 3001 Leuven, Belgium
e-mail: timothy.vanreeth@kuleuven.be
2
Astrophysics Group, Keele University, Staffordshire ST5 5BG, UK
Received:
3
December
2021
Accepted:
12
January
2022
Context. Many well-known bright stars have been observed by the ongoing transiting exoplanet survey satellite (TESS) space mission. For several of them, these new data reveal previously unobserved variability, such as tidally perturbed pulsations in close binary stars.
Aims. Using newly detected gravity-mode (g-mode) pulsations in V456 Cyg, we aim to determine the global stellar properties of this short-period eclipsing binary and evaluate the interaction between these pulsations and the tides.
Methods. We model the binary orbit and determine the physical properties of the component stars using the TESS photometry and published spectroscopy. We then measure the pulsation frequencies from the residuals of the light curve fit using iterative prewhitening, and analyse them to determine the global asteroseismic stellar parameters. We evaluate the pulsation parameters as a function of the orbital phase.
Results. We find that the pulsations belong to the secondary component of V456 Cyg and that this star likely has a uniform radial rotation profile, synchronous (νrot = 1.113 (14) d−1) with the binary orbit (νorb = 1.122091 (8) d−1). The observed g modes are amplified by almost a factor three in the stellar hemisphere facing the primary. We present evidence that this is caused by tidal perturbation of the pulsations, with the mode coupling being strongly affected.
Conclusions. V456 Cyg is only the second object for which tidally perturbed high-order g-mode pulsations are identified, after π5 Ori. This opens up new opportunities for tidal g-mode asteroseismology, as it demonstrates another avenue in which g modes and tides can interact with each other.
Key words: asteroseismology / binaries: eclipsing / stars: oscillations / stars: rotation / stars: individual: V456 Cyg
© ESO 2022
1. Introduction
In the study of stellar structure and evolution (e.g. Kippenhahn et al. 2012), binary stars can both improve and complicate the analyses. By modelling the orbits using both photometric and spectroscopic observations, stellar properties such as mass and radius can be determined up to 1% accuracy for the binary components (e.g. Torres et al. 2010). However, binary interaction also affects stellar evolution, for example via tides (e.g. Ahuir et al. 2021; Zanazzi & Wu 2021) and mass transfer (e.g. Shao & Li 2016; Vos et al. 2019). These processes are not yet well understood, and given that many stars are part of multiple systems (e.g. Raghavan et al. 2010; Sana et al. 2012; Moe & Di Stefano 2017), this remains one of the most important questions in astronomy.
Asteroseismology, the study of stellar structure and evolution via the analysis of stellar pulsations (e.g. Aerts et al. 2010), complements the study of binary stars (e.g. Beck et al. 2018; Johnston et al. 2019; Guo 2021; Sekaran et al. 2021). Gravity (g) modes, which have buoyancy as the dominant restoring force and are sensitive to the near-core radiative region in intermediate- to high-mass stars with convective cores such as γ Doradus (γ Dor, with 1.4 M⊙ ≲ M* ≲ 1.8 M⊙; Kaye et al. 1999) and slowly pulsating B stars (SPB, with 2.5 M⊙ ≲ M* ≲ 8 M⊙; Waelkens 1991), are especially valuable. They can be used to measure stellar age (e.g. Szewczuk & Daszyńska-Daszkiewicz 2018; Mombarg et al. 2019; Wu et al. 2020; Michielsen et al. 2021; Pedersen et al. 2021), rotation (e.g. Bouabid et al. 2013; Van Reeth et al. 2016; Christophe et al. 2018; Li et al. 2020; Takata et al. 2020a,b; Szewczuk et al. 2021), near-core and envelope mixing (e.g. Szewczuk & Daszyńska-Daszkiewicz 2018; Wu & Li 2019; Wu et al. 2020; Mombarg et al. 2020; Pedersen et al. 2021), and internal magnetic fields (e.g. Buysschaert et al. 2018; Prat et al. 2019; Lecoanet et al. 2022), thanks to high-quality space photometry from missions such as CoRoT (Auvergne et al. 2009), Kepler (Borucki et al. 2010; Koch et al. 2010), BRITE (Weiss et al. 2014), and TESS (Ricker et al. 2015). However, the pulsations themselves also affect stellar properties. For example, inertial and overstable convective modes in the convective core, which have the Coriolis force as the dominant restoring force, can couple with g modes in the radiative envelope, leading to angular momentum transport between the core and the envelope (e.g. Ouazzani et al. 2020; Saio et al. 2021; Lee 2021a).
In multiple systems, tides can also influence stellar pulsations. In eccentric binaries with a close periastron passage, dynamical tides can excite tidal oscillations, with frequencies at integer multiples of the orbital frequency (e.g. Fuller 2017; Hambleton et al. 2018; Cheng et al. 2020). In other binaries, g-mode oscillations and tides couple non-linearly (e.g. Burkart et al. 2012, 2014; Weinberg et al. 2013; Guo et al. 2017), with sums of non-harmonic mode frequencies being equal to orbital harmonics. When tidal deformation of stars perturbs pulsation mode cavities, the pulsation frequencies split into  multiplets (e.g. Reyniers & Smeyers 2003a,b; Balona 2018). These depend on the mode geometries (
 ) with respect to the tidal axis, which connects the centres of mass of the binary components, where
  and
and  indicate the spherical degree and azimuthal order, respectively. Stellar rotation further splits each of these frequencies into (2ℓ+1) multiplets, which are non-equidistant because of the Coriolis force (e.g. Bouabid et al. 2013), in the observer’s inertial reference frame. Here the mode geometry (ℓ, m) is defined with respect to the rotational axis. Fuller et al. (2020) also included tidal pulsation coupling in this theoretical framework, demonstrating that this may amplify or trap pulsations in a hemisphere of the star, calling them tidally tilted pulsations. So far, tidal perturbation and tilting of pressure (p-)mode pulsations has been detected for about a dozen targets (e.g. Hambleton et al. 2013; Balona 2018; Samadi Ghadim et al. 2018; Bowman et al. 2019; Handler et al. 2020; Kurtz et al. 2020; Rappaport et al. 2021; Steindl et al. 2021; Southworth et al. 2020, 2021; Lee 2021b; Kahraman Aliçavuş et al. 2022), while tidally perturbed g modes have only been found for one star (Jerzykiewicz et al. 2020).
In this work, we present the discovery of tidally perturbed g-mode pulsations in the eclipsing binary system V456 Cyg. It was first identified as an eclipsing binary by Morgenroth (1935) and classified as an Algol system. Following increasingly accurate measurements of the orbital period (Savedoff 1951; Whitney 1959), the detection of apsidal motion was reported (e.g. Wood & Forbes 1963). Over the following decades, V456 Cyg was a target of several observational campaigns, both confirming (e.g. Flin 1969; Mallama 1980) and disproving (e.g. Hegedüs 1988) this detection. Using modern observations, Nelson (2011) showed that the ephemerides are constant and determined that the orbit is quasi-circular, with an eccentricity of 0.0016 (6). Bakış et al. (2014) confirmed these results after spectral disentangling of 12 low-resolution spectra (R ∼ 5100) from the TÜBİTAK Faint Object Spectrograph and Camera (TFOSC) at the Russian and Turkish Telescope (RTT), located at the TÜBİTAK National Observatory (TUG, Turkey). Bakış et al. (2014) determined the properties of the system, finding the primary to be a slightly metal-weak A-type star with a mass of 1.86 ± 0.06 M⊙ and the secondary to be an early F-type star with a mass of 1.58 ± 0.05 M⊙. The properties of the secondary put it either in or close to the γ Dor instability strip in the HR diagram. Based on earlier measurements, Soydugan et al. (2006) had already classified V456 Cyg as a candidate δ Scuti pulsator. Although it is located within the instability strip, no pulsations were detected during following ground-based observational campaigns (Dvorak 2009; Liakos & Niarchos 2009). While a large fraction of stars in the δ Scuti instability strip do not pulsate (Murphy et al. 2019), the cause and correlations with other stellar aspects, such as metallicity and binarity, are not yet known.
In the following sections, we outline the TESS observations (Sect. 2), measure the properties of the component stars (Sect. 3), and perform an asteroseismic analysis of the TESS photometry (Sect. 4) of V456 Cyg. We report the detection of g-mode pulsations (Sect. 4.1), use them to measure the near-core rotation rate of the secondary (Sect. 4.2), and provide evidence for their tidally perturbed nature (Sect. 4.3). Finally, we discuss our results and their implications for the tidal coupling of g-mode pulsations (Sect. 5).
2. TESS photometry
The TESS mission (Ricker et al. 2015) has provided time series broad-band photometry of ∼85% of the sky since July 2018. During the nominal mission, full frame images (FFI) were taken at a 30-min cadence, yielding raw photometry for ∼10 million stars brighter than 13.5 mag in the TESS passband (Huang et al. 2020a,b). For over 200 000 selected stars, “postage stamp” pixel data centred on the stars were also collected at a 2-min cadence (e.g. Stassun et al. 2018).
V456 Cyg was observed by TESS during sectors 14 and 15 (2019 July 18 to 2019 Sep. 11). These target pixel files (TPF) were reduced and light curves were extracted by the TESS science processing operations center (SPOC; Jenkins et al. 2016) using simple aperture photometry (SAP). In addition to these SAP light curves, the SPOC also provides pre-search data conditioning (PDC) SAP light curves, optimised for the detection of exoplanet transits and from which instrumental variability was removed using cotrending base vectors. However, this reduction process can also affect intrinsic longer-period variability such as from binarity. Hence, we used the SAP light curve for the analysis of V456 Cyg. The TESS data are shown in Fig. 1 after conversion to relative magnitude and linear detrending.
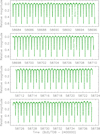 |
Fig. 1. TESS light curves of V456 Cyg from sectors 14 (top two panels) and 15 (bottom two panels). The data have been converted to relative magnitude and rectified to zero magnitude by subtraction of a straight-line fit to the data. |
3. Binary model
Our first analysis step was to model the effects of binarity in the TESS light curve for two reasons: to determine the physical properties of the stars and to obtain a light curve from which the effects of binarity had been removed. For this we used version 42 of the JKTEBOP1 code (Southworth et al. 2004; Southworth 2013). This code works with the fractional radii of the stars, rA and rB, which are the true radii divided by the semi-major axis of the relative orbit. We fitted for their sum (rA + rB) and ratio ( ), the orbital inclination (i), period (P), reference time of primary eclipse (T0), the ratio of the central surface brightness values of the stars (J), and the third light (L3). We refer to the hotter and more massive star as star A and its companion as star B.
The orbital eccentricity of V456 Cyg is negligible, and consistent with zero to within three times its very small error bars, so we assumed a circular orbit. Limb darkening (LD) was included using the quadratic law with theoretical coefficients taken from Claret (2017). We fitted for the linear coefficient of each star and fixed the quadratic coefficients to the theoretical values. We also fitted low-order polynomials to the out-of-eclipse brightness of the system to remove any slow trends of brightness with time: in the case of V456 Cyg it was found that a quadratic function for each of the four light curve segments (as plotted in Fig. 1) was adequate. We obtained a good fit to the TESS data.
To determine the uncertainties in the fitted parameters we ran the Monte Carlo and residual-permutation simulations implemented in JKTEBOP (Southworth 2008). Prior to this step we rescaled the errorbars in the SAP data to give a reduced χ2 of  . The Monte Carlo simulations account for correlations between photometric parameters. The residual-permutation simulations are sensitive to low-frequency variability in data, so are useful to account for the effects of the pulsations present in this system. We adopted the larger of the two errorbars for each parameter, which in most cases was that from the Monte Carlo simulations. The third light comes out slightly negative but we have retained this in order to avoid underestimating the errorbars of the measured parameters – a plausible reason for this is a slight overestimation of the sky background during the data reduction process. The resulting parameters and errorbars are collected in Table 1.
Bakış et al. (2014) measured velocity amplitudes for the two stars from time-series spectroscopy, which we used to determine the full physical properties of the system (Table 1). This was done using the JKTABSDIM code (Southworth et al. 2005), which implements standard equations and propagates errorbars using a perturbation analysis. We used the IAU nominal solar properties and physical constants (Prša et al. 2016) for compatibility with other work. Our mass measurements agree well with those found by Bakış et al. (2014), as expected, but our radius measurements differ by roughly 5σ. Our results are likely more precise as they are based on much more extensive and high-precision TESS photometry; the discrepancy can be assigned to the pulsation signature present in the light curve. The masses of the stars are measured to 2.3% precision: we are in the process of obtaining new spectroscopy to improve these measurements. Our surface brightness ratio indicates a secondary star effective temperature (Teff) of 7250 ± 120 K, considerably higher than found by Bakış et al. (2014) (6755 ± 400 K), when we adopt their primary star Teff value.
We have determined the distance to V456 Cyg using the physical properties of the system, apparent magnitudes in the BV (Høg et al. 2000) and JHKs bands (Cutri et al. 2003), and the bolometric corrections from Girardi et al. (2002). The requirement of consistent distances across the optical and infrared passbands could be satisfied by adopting a small reddening value of E(B − V) = 0.05 ± 0.01 mag, and returned distances in excellent agreement with the value of 587.5 ± 4.3 pc from Gaia EDR3 (Gaia Collaboration 2021). This consistency supports the evidence of the reliability of the physical properties determined here and the Teff measured by Bakış et al. (2014) for star A.
4. Asteroseismic analysis
4.1. Frequency analysis
After the binary modelling, we determined the pulsation frequencies by iteratively prewhitening the residual light curve (hereafter called the pulsation light curve), using the code from Van Beeck et al. (2021). At each step, we selected the frequency νi with the highest signal-to-noise ratio (S/N) in the Lomb-Scargle periodogram (Scargle 1982) of the light curve and determined the corresponding amplitude Ai and phase ϕi by non-linearly fitting a sine wave of the form Aisin(2πνi(t−t0)+ϕi) to the light curve, using the mean timestamp of the photometric data points as the zero point t0. Measured frequencies were selected until none remained with S/N > 4 (Breger et al. 1993), which was calculated within a 1 d−1 window in the Lomb-Scargle periodogram.
First, we prewhitened the full pulsation light curve, shown in Fig. 2. The frequency values are listed in Table 2 (νa to νn) and illustrated in the middle of Fig. 3. Four of these fourteen frequencies are independent, with typical values for prograde dipole g-modes with (ℓ,m) = (1, 1). The other frequencies are combinations, spaced integer multiples of νorb away from one of the two dominant pulsation frequencies, or differ less than the frequency resolution fres = 1/T from an orbital harmonic frequency, where T is the time span covered by the light curve. This can be explained by the amplitude modulation of the light curve during the eclipses, as seen in Fig. 2. The observed pulsation amplitudes are larger (smaller) during the primary (secondary) eclipse, indicating that the g modes belong to the secondary component of V456 Cyg.
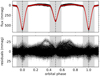 |
Fig. 2. Reduced light curve of V456 Cyg, phase-folded over the binary orbit. The eclipses are indicated in grey. Top: original light curve (black) with the best-fitting binary model (red). Bottom: residual light curve, called the pulsation light curve in this work. |
Overview of the measured frequencies, including the identified combinations (within a 3-σ limit).
We then compared these results with frequencies measured for the out-of-eclipse part of the pulsation light curve, shown in the white sections of Fig. 2. These out-of-eclipse frequencies are listed in the bottom half of Table 2 (ν1 to ν11) and are illustrated in the bottom panel of Fig. 3. As expected, most of the previously found νorb-spacings were caused by the amplitude modulations during the eclipses, and are no longer present. However, several new νorb-spacings and combinations are detected. This indicates further orbital-phase-dependent amplitude modulation of the observed pulsations in the out-of-eclipse part of the light curve, and points to possible tidal perturbation of these g-mode pulsations. This is discussed in detail in Sect. 4.3.
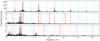 |
Fig. 3. Lomb-Scargle periodograms of the reduced light curve of V456 Cyg. Top: periodogram of the full reduced light curve of V456 Cyg, with the harmonics of the orbital frequency νorb indicated by full light-blue lines. Middle: periodogram of the full pulsation light curve. The frequencies that were detected from this light curve (νa to νn in Table 2) are marked in red. Full and dashed lines mark the independent frequencies and combination frequencies, respectively. Bottom: periodogram of the out-of-eclipse part of the pulsation light curve. The frequencies that were detected from this light curve (ν1 to ν11 in Table 2) are marked in red. Full and dashed lines mark the independent frequencies and combination frequencies, respectively. The dash-dotted line is the only combination frequency that does not include the orbital frequency νorb. |
4.2. Near-core rotation
In the first part of our analysis, we determined the near-core rotation rate νrot and the buoyancy travel time Π0 of the secondary component by fitting the four independent g-mode frequencies between 1.75 d−1 and 2.35 d−1 (νb to νe). Because g modes in rotating stars are strongly influenced by the Coriolis force (e.g. Bouabid et al. 2013; Aerts et al. 2018) and less sensitive to non-spherical deformations of the star (Henneco et al. 2021; Dhouib et al. 2021), we ignored the tidal effects on the g-mode frequencies (e.g. Balona 2018) and used the traditional approximation of rotation (TAR; Eckart 1960; Bildsten et al. 1996; Lee & Saio 1997), whereby the horizontal component of the rotation vector is neglected. Assuming that all four g modes have the same geometry with respect to the rotation axis of the star, we fitted the frequencies νb to νe with asymptotic g-mode frequencies
where (n, ℓ, m) is the mode identification, s = 2νrot/(νnℓm − mνrot) the spin parameter, and αg a phase term dependent on the boundaries of the g-mode cavity (Van Reeth et al. 2016). While multiple valid solutions (listed in Table 3) were found, the νrot value of the first solution matches the orbital frequency νorb well within its 99%-confidence interval. This indicates that the secondary component is synchronously rotating, as expected for such short-period binaries. Therefore, this is the most likely true solution. The corresponding theoretical g-mode pattern is illustrated in Fig. 4.
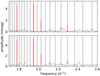 |
Fig. 4. Best-fitting asymptotic g-mode pattern (dashed lines), with the measured independent pulsation frequencies (red full lines) and the Fourier transform of the residual light curve after prewhitening the measured pulsation frequencies. This is shown for both the full light pulsation curve (top) and the out-of-eclipse pulsation light curve (bottom). |
Rotation rates νrot and buoyancy travel times Π0 for the best-fitting asymptotic g-mode patterns, with conservative error margins derived from the 99%-confidence interval.
Additionally, two implicit assumptions were made in this analysis. First, the length of our light curve, 54 days, is insufficient to resolve most prograde dipole g-modes with consecutive radial orders (as can be seen in Fig. 4). Hence, we assumed that the amplitudes of the undetected g modes are much smaller than those listed in Table 2, so that our measured pulsation frequencies were not affected. Second, we ignored possible modulations or glitches in the g-mode pattern (e.g. Miglio et al. 2008; Ouazzani et al. 2020), which can affect the measured values of νrot and Π0 (Christophe et al. 2018). Because of our small number of modelled frequencies, we likely overfitted the observations and underestimated the error margins of the model parameters. To compensate, we report the conservative error margins associated with the 99%-confidence interval, rather than the 1-σ error margins. Hence, given our accurate derived νrot-value, we can conclude that these implicit conditions were also fulfilled.
4.3. Evidence for tidally perturbed pulsations
As discussed in Sect. 4.1, the detected g-modes are part of νorb-spaced multiplets and exhibit orbital-phase-dependent amplitude modulation. There are multiple physical processes that can cause this, including the phase-dependent light contribution of the pulsating star in the binary (e.g. Steindl et al. 2021), Doppler beaming (e.g. Zucker et al. 2007), the light-travel-time effect (e.g. Murphy & Shibahashi 2015), tidally excited (e.g. Fuller 2017) and tidally perturbed pulsations (e.g. Reyniers & Smeyers 2003a,b; Fuller et al. 2020).
To determine the cause(s), we divided the observed data points in different bins as a function of orbital phase, and non-linearly fitted the three dominant g-modes (νb to νd; ν2 to ν4) within each bin, keeping the frequencies fixed. The results were validated by doing the analysis for different numbers of bins (varying from 5 to 40), and are illustrated in Fig. 5 for 20 bins (with ∼1800 data points per bin). We can see that all three g modes behave similarly. The pulsation phases vary slowly and contemporaneously during the out-of-eclipse phases and exhibit jumps of π/2 rad during the secondary eclipse. Their amplitudes are maximal just before and after the secondary eclipse, and appear to be larger (smaller) during the primary (secondary) eclipse because the light contribution by the pulsating star varies. We verified this by estimating the relative pulsation amplitude modulation at the secondary eclipse as

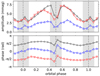 |
Fig. 5. Amplitude (top) and phase (bottom) variability of the three dominant independent pulsations of V456 Cyg, measured from the out-of-eclipse residual light curve: ν2 (red downward triangles), ν3 (black circles) and ν4 (blue upward triangles). The eclipses are indicated in grey, with a dashed line marking their centres. |
where L2/1 is the binary light ratio given in Table 1 and L2/1, ecl is the effective light ratio at mid-eclipse, calculated as

with Δmecl the secondary eclipse depth in magnitude. For V456 Cyg we obtained δA = 0.34 (2), but because the secondary eclipse signal is smeared out in the orbital phase bins used in Fig. 5, the amplitude modulations shown in this figure are less pronounced.
A first possible explanation for the pulsation modulations, the geometry of the binary system, is insufficient. The orbital-phase-dependent behaviour of the different g-modes is similar, but not identical. The modulations would not differ between pulsations if they were caused by ellipsoidal variability, Doppler beaming or the light-travel-time effect. Furthermore, the amplitude and phase variations during the out-of-eclipse phases are too large to be explained by the binary geometry. The pulsation amplitudes vary by a factor three, while the phase variations are ∼200 times larger than expected from the binary orbit time delays.
Tidally excited pulsations are also not the cause of the observed modulations. As we have shown in Sects. 3 and 4.2, V456 Cyg is a synchronised and circularised binary. Hence, the tides cannot dynamically excite pulsation modes here (Guo 2021). Additionally, neither the independent g-mode frequencies nor their combinations coincide with orbital harmonic frequencies, as we can see in Fig. 3.
Therefore, tidal perturbation of the pulsations is the best explanation for the pulsation amplitude and phase variations of V456 Cyg. As discussed in Sect. 4.2, the tidal perturbation of the g-mode pulsation cavity is sufficiently small that the impact on the g-mode frequencies appears to be negligible, but the observed modulations of the amplitudes and phases are much stronger.
The tidal perturbation of pulsations can also include tidal tilting. Indeed, if we account for the eclipse modulations of the pulsation amplitudes in Fig. 5, the observed amplitude variability of the g modes is observationally reminiscent of the model developed by Fuller et al. (2020) for  modes in HD 74423. But as shown by Fuller et al. (2020), pure tilted
  -modes are expected to exhibit either 0 rad or π rad pulsation phase modulations over the binary orbit. Our observed pulsation phase modulations are small but non-zero, which indicates that the pulsations have non-axisymmetric components (with respect to the tidal axis; Fuller et al. 2020), consistent with our pulsation mode identification with respect to the rotation axis, (ℓ,m) = (1, 1). However, because the current theoretical framework for tidally tilted pulsations does not account for the Coriolis force, a more detailed evaluation of the true pulsation axis lies outside the scope of this work. The pulsations of V456 Cyg are high-order g modes in the subinertial regime, where the contribution of the Coriolis force is non-negligible and has to be treated non-perturbatively (Aerts 2021).
Additionally, tides are known to affect non-linear pulsation mode coupling (e.g. Fuller et al. 2020; Guo 2021). To further evaluate the influence of tides on the g-mode coupling in V456 Cyg, we analysed the coupled modes ν2, ν3 and ν5. Based on the values listed in Table 2, these pulsations fulfil the formal criteria of coupled modes, ∑iνparent, i = νchild and ∑iϕparent, i = ϕchild + kπ/2 with k ∈ ℤ (e.g. Buchler et al. 1997; Vuille & Brassard 2000), within 2σ. This is investigated further in Fig. 6, where we show the amplitude and phase variability of ν5 as a function of the orbital phase, and compare them with the product of the amplitudes and the sum of the phases of ν2 and ν3, respectively. These quantities are commonly used to investigate the non-linear coupling and the relative damping and excitation rates of the pulsations (e.g. Dziembowski 1982; Lee 2012; Saio et al. 2018). For example, Bowman et al. (2016) used them to define the coupling factor μ between parent frequencies νp1 and νp2 and the child frequency νc as μ = Ac/(Ap1Ap2), to investigate coupling between p-mode pulsations. Here in our work, we see in Fig. 6 that there is a small orbital phase shift between the amplitude variability of ν5 and of ν2 and ν3. Moreover, the phases ϕ5 and ϕ2 + ϕ3 differ as a function of the orbital phase, so the pulsation phase criterion of coupled modes is no longer fulfilled. When the amplitude of ν5 is dominant during the out-of-eclipse orbital phases, the difference between the phases ϕ5 and ϕ2 + ϕ3 steadily decreases. These differences may provide detailed information about the role of tides in g-mode coupling in binaries.
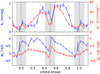 |
Fig. 6. Amplitude (top) and phase (bottom) variability of the combination frequency ν5 = ν2 + ν3 (blue circles), measured from the out-of-eclipse residual light curve, as a function of the orbital phase. These are compared with the relative amplitude scaling factor A2 ⋅ A3 and the sum of the parent frequency phases ϕ2 + ϕ3 (red downward triangles; e.g. Buchler et al. 1997; Vuille & Brassard 2000). |
5. Discussion and conclusions
We report the second detection of tidally perturbed g-mode pulsations in the short-period binary V456 Cyg, after the detection in π5 Ori by Jerzykiewicz et al. (2020). Other reports in the literature of tidally perturbed or tilted pulsations were limited to p modes and mixed p- and g-mode pulsations.
The observed g modes belong to the secondary component, which has a uniform radial rotation profile, with νrot = 1.113 (14) d−1, synchronous with the binary orbital frequency. The measured value of the buoyancy travel time Π0, 4377 ± 140 s, places the secondary well within the γ Dor instability strip, in agreement with the derived values for its mass (1.576 ± 0.037 M⊙) and Teff (7250 ± 120 K).
The observed g mode pulsations exhibit orbital-phase-dependent amplitude and phase variability. The three most dominant g modes all show similar amplitude variability, reminiscent of the theoretical models developed by Fuller et al. (2020) for HD 74423. Their amplitudes are amplified around the secondary eclipse and modulated by the reduced flux from the secondary component during the eclipse itself. This indicates that the g modes are amplified on the side of the secondary facing the primary in V456 Cyg. By contrast, the g-mode frequencies are much less affected by the tides, as demonstrated by our successful asymptotic g-mode modelling using the TAR, which assumes spherical symmetry. There is also an indication of tidal influence on the non-linear g-mode coupling in V456 Cyg, given by the comparison between the amplitudes and phases of the frequencies ν2, ν3 and ν5 (=ν2 + ν3). The formal criteria to classify these as coupled pulsation modes (Vuille & Brassard 2000) are fulfilled when they are evaluated using the entire out-of-eclipse pulsation light curve. However, this is not the case when these pulsations are evaluated as a function of the orbital phase, providing strong observational indications of tidal modulation of mode coupling in V456 Cyg.
The discovery of tidally perturbed g modes in V456 Cyg presents us with a new opportunity. Since g-mode pulsators have dense pulsation frequency spectra, such targets require long time series of space-based data to resolve individual pulsations (e.g. Li et al. 2020; Garcia et al. 2022). However, the radial orders n of the observed g-mode pulsations of V456 Cyg are a bit lower than usual (Li et al. 2020), with values between 18 and 31. This part of the g-mode spectrum is less dense, and because the dominant pulsation modes have much higher amplitudes than the neighbouring modes with consecutive radial orders, we were able to resolve these dominant g modes, despite only having 54 days of observations. Moreover, previous detections of tidally perturbed or tilted pulsations were limited to p-mode and mixed p- and g-mode pulsators. Thanks to the existing theoretical frameworks (e.g. Miglio et al. 2008; Bouabid et al. 2013; Mathis 2009; Prat et al. 2019; Ouazzani et al. 2020), g-mode pulsations are often easier to analyse than p modes in moderate- to fast-rotating stars, making V456 Cyg an interesting target for further follow-up studies. We expect that in future, more detections of tidally perturbed g-mode pulsations will be reported in the literature.
Acknowledgments
T.V.R. gratefully acknowledges a postdoctoral fellowship from the Research Foundation Flanders (FWO) with grant agreement N° 12ZB620N. J.V.B. acknowledges receiving support from the Research Foundation Flanders (FWO) under grant agreement N° V421221N. D.M.B. gratefully acknowledges a senior post-doctoral fellowship from the Research Foundation Flanders (FWO) with grant agreement N° 1286521N. The research leading to these results received partial funding from the KU Leuven Research Council (grant C16/18/005: PARADISE). We are grateful to Jim Fuller for useful discussions and we thank the referee, Don Kurtz, for his useful and constructive comments which improved the contents of this paper. This paper includes data collected with the TESS mission, obtained from the MAST data archive at the Space Telescope Science Institute (STScI). Funding for the TESS mission is provided by NASA’s Science Mission Directorate. We thank the whole team for the development and operations of the mission. STScI is operated by the Association of Universities for Research in Astronomy, Inc., under NASA contract NAS 5-26555. This research made use of the SIMBAD database, operated at CDS, Strasbourg, France, NASA’s Astrophysics Data System Bibliographic Services, and the VizieR catalogue access tool, CDS, Strasbourg, France. This research also made use of Astropy (http://www.astropy.org) (a community-developed core Python package for Astronomy; Astropy Collaboration 2013, 2018), lmfit (Newville et al. 2019), Matplotlib (the Python library for publication quality graphics; Hunter 2007), and Numpy (Harris et al. 2020).
References
- Aerts, C. 2021, Rev. Mod. Phys., 93, 015001 [Google Scholar]
- Aerts, C., Christensen-Dalsgaard, J., & Kurtz, D. W. 2010, Asteroseismology (Springer Science+Business Media B.V.) [Google Scholar]
- Aerts, C., Molenberghs, G., Michielsen, M., et al. 2018, ApJS, 237, 15 [Google Scholar]
- Ahuir, J., Mathis, S., & Amard, L. 2021, A&A, 651, A3 [NASA ADS] [CrossRef] [EDP Sciences] [Google Scholar]
- Astropy Collaboration (Robitaille, T. P., et al.) 2013, A&A, 558, A33 [NASA ADS] [CrossRef] [EDP Sciences] [Google Scholar]
- Astropy Collaboration (Price-Whelan, A. M., et al.) 2018, AJ, 156, 123 [Google Scholar]
- Auvergne, M., Bodin, P., Boisnard, L., et al. 2009, A&A, 506, 411 [NASA ADS] [CrossRef] [EDP Sciences] [Google Scholar]
- Bakış, V., Hensberge, H., Bilir, S., et al. 2014, AJ, 147, 149 [CrossRef] [Google Scholar]
- Balona, L. A. 2018, MNRAS, 476, 4840 [NASA ADS] [CrossRef] [Google Scholar]
- Beck, P. G., Kallinger, T., Pavlovski, K., et al. 2018, A&A, 612, A22 [NASA ADS] [CrossRef] [EDP Sciences] [Google Scholar]
- Bildsten, L., Ushomirsky, G., & Cutler, C. 1996, ApJ, 460, 827 [NASA ADS] [CrossRef] [Google Scholar]
- Borucki, W. J., Koch, D., Basri, G., et al. 2010, Science, 327, 977 [Google Scholar]
- Bouabid, M.-P., Dupret, M.-A., Salmon, S., et al. 2013, MNRAS, 429, 2500 [NASA ADS] [CrossRef] [Google Scholar]
- Bowman, D. M., Kurtz, D. W., Breger, M., Murphy, S. J., & Holdsworth, D. L. 2016, MNRAS, 460, 1970 [NASA ADS] [CrossRef] [Google Scholar]
- Bowman, D. M., Johnston, C., Tkachenko, A., et al. 2019, ApJ, 883, L26 [Google Scholar]
- Breger, M., Stich, J., Garrido, R., et al. 1993, A&A, 271, 482 [NASA ADS] [Google Scholar]
- Buchler, J. R., Goupil, M. J., & Hansen, C. J. 1997, A&A, 321, 159 [NASA ADS] [Google Scholar]
- Burkart, J., Quataert, E., Arras, P., & Weinberg, N. N. 2012, MNRAS, 421, 983 [NASA ADS] [CrossRef] [Google Scholar]
- Burkart, J., Quataert, E., & Arras, P. 2014, MNRAS, 443, 2957 [NASA ADS] [CrossRef] [Google Scholar]
- Buysschaert, B., Aerts, C., Bowman, D. M., et al. 2018, A&A, 616, A148 [NASA ADS] [CrossRef] [EDP Sciences] [Google Scholar]
- Cheng, S. J., Fuller, J., Guo, Z., Lehman, H., & Hambleton, K. 2020, ApJ, 903, 122 [NASA ADS] [CrossRef] [Google Scholar]
- Christophe, S., Ballot, J., Ouazzani, R.-M., Antoci, V., & Salmon, S. J. A. J. 2018, A&A, 618, A47 [NASA ADS] [CrossRef] [EDP Sciences] [Google Scholar]
- Claret, A. 2017, A&A, 600, A30 [NASA ADS] [CrossRef] [EDP Sciences] [Google Scholar]
- Cutri, R. M., Skrutskie, M. F., van Dyk, S., et al. 2003, 2MASS All Sky Catalogue of Point Sources, The IRSA 2MASS All-Sky Point Source Catalogue, NASA/IPAC Infrared Science Archive, Caltech, US [Google Scholar]
- Dhouib, H., Prat, V., Van Reeth, T., & Mathis, S. 2021, A&A, 652, A154 [NASA ADS] [CrossRef] [EDP Sciences] [Google Scholar]
- Dvorak, S. 2009, Commun. Asteroseismol., 160, 64 [Google Scholar]
- Dziembowski, W. 1982, Acta Astron., 32, 147 [NASA ADS] [Google Scholar]
- Eckart, G. 1960, Hydrodynamics of Oceans and Atmospheres (Oxford: Pergamon Press) [Google Scholar]
- Flin, P. 1969, Inf. Bull. Var. Stars, 328, 1 [NASA ADS] [Google Scholar]
- Fuller, J. 2017, MNRAS, 472, 1538 [Google Scholar]
- Fuller, J., Kurtz, D. W., Handler, G., & Rappaport, S. 2020, MNRAS, 498, 5730 [NASA ADS] [CrossRef] [Google Scholar]
- Gaia Collaboration (Brown, A. G. A., et al.) 2021, A&A, 649, A1 [NASA ADS] [CrossRef] [EDP Sciences] [Google Scholar]
- Garcia, S., Van Reeth, T., De Ridder, J., et al. 2022, A&A, accepted, [arXiv:2202.10507] [Google Scholar]
- Girardi, L., Bertelli, G., Bressan, A., et al. 2002, A&A, 391, 195 [NASA ADS] [CrossRef] [EDP Sciences] [Google Scholar]
- Guo, Z. 2021, Front. Astron. Space Sci., 8, 67 [NASA ADS] [Google Scholar]
- Guo, Z., Gies, D. R., & Fuller, J. 2017, ApJ, 834, 59 [Google Scholar]
- Hambleton, K. M., Kurtz, D. W., Prša, A., et al. 2013, MNRAS, 434, 925 [Google Scholar]
- Hambleton, K., Fuller, J., Thompson, S., et al. 2018, MNRAS, 473, 5165 [Google Scholar]
- Handler, G., Kurtz, D. W., Rappaport, S. A., et al. 2020, Nat. Astron., 4, 684 [Google Scholar]
- Harris, C. R., Millman, K. J., van der Walt, S. J., et al. 2020, Nature, 585, 357 [NASA ADS] [CrossRef] [Google Scholar]
- Hegedüs, T. 1988, Bulletin d’Information du Centre de Données Stellaires, 35, 15 [NASA ADS] [Google Scholar]
- Henneco, J., Van Reeth, T., Prat, V., et al. 2021, A&A, 648, A97 [EDP Sciences] [Google Scholar]
- Høg, E., Fabricius, C., Makarov, V. V., et al. 2000, A&A, 355, L27 [Google Scholar]
- Huang, C. X., Vanderburg, A., Pál, A., et al. 2020a, Res. Notes Am. Astron. Soc., 4, 204 [Google Scholar]
- Huang, C. X., Vanderburg, A., Pál, A., et al. 2020b, Res. Notes Am. Astron. Soc., 4, 206 [Google Scholar]
- Hunter, J. D. 2007, Comput. Sci. Eng., 9, 90 [NASA ADS] [CrossRef] [Google Scholar]
- Jenkins, J. M., Twicken, J. D., McCauliff, S., et al. 2016, in Software and Cyberinfrastructure for Astronomy IV, eds. G. Chiozzi, & J. C. Guzman, SPIE Conf. Ser., 9913, 99133E [Google Scholar]
- Jerzykiewicz, M., Pigulski, A., Handler, G., et al. 2020, MNRAS, 496, 2391 [NASA ADS] [CrossRef] [Google Scholar]
- Johnston, C., Tkachenko, A., Aerts, C., et al. 2019, MNRAS, 482, 1231 [Google Scholar]
- Kahraman Aliçavuş, F., Handler, G., Aliçavuş, F., et al. 2022, MNRAS, 510, 1413 [Google Scholar]
- Kaye, A. B., Handler, G., Krisciunas, K., Poretti, E., & Zerbi, F. M. 1999, PASP, 111, 840 [Google Scholar]
- Kippenhahn, R., Weigert, A., & Weiss, A. 2012, Stellar Structure and Evolution (Berlin, Heidelberg: Springer) [Google Scholar]
- Koch, D. G., Borucki, W. J., Basri, G., et al. 2010, ApJ, 713, L79 [Google Scholar]
- Kurtz, D. W., Handler, G., Rappaport, S. A., et al. 2020, MNRAS, 494, 5118 [Google Scholar]
- Lecoanet, D., Bowman, D. M., & Van Reeth, T. 2022, MNRAS, 512, L16 [NASA ADS] [CrossRef] [Google Scholar]
- Lee, U. 2012, MNRAS, 420, 2387 [NASA ADS] [CrossRef] [Google Scholar]
- Lee, U. 2021a, MNRAS, 505, 1495 [NASA ADS] [CrossRef] [Google Scholar]
- Lee, J. W. 2021b, PASJ, 73, 809 [NASA ADS] [CrossRef] [Google Scholar]
- Lee, U., & Saio, H. 1997, ApJ, 491, 839 [Google Scholar]
- Li, G., Van Reeth, T., Bedding, T. R., et al. 2020, MNRAS, 491, 3586 [Google Scholar]
- Liakos, A., & Niarchos, P. 2009, Commun. Asteroseismol., 160, 2 [Google Scholar]
- Mallama, A. D. 1980, ApJS, 44, 241 [NASA ADS] [CrossRef] [Google Scholar]
- Mathis, S. 2009, A&A, 506, 811 [CrossRef] [EDP Sciences] [Google Scholar]
- Michielsen, M., Aerts, C., & Bowman, D. M. 2021, A&A, 650, A175 [NASA ADS] [CrossRef] [EDP Sciences] [Google Scholar]
- Miglio, A., Montalbán, J., Noels, A., & Eggenberger, P. 2008, MNRAS, 386, 1487 [Google Scholar]
- Moe, M., & Di Stefano, R. 2017, ApJS, 230, 15 [Google Scholar]
- Mombarg, J. S. G., Van Reeth, T., Pedersen, M. G., et al. 2019, MNRAS, 485, 3248 [NASA ADS] [CrossRef] [Google Scholar]
- Mombarg, J. S. G., Dotter, A., Van Reeth, T., et al. 2020, ApJ, 895, 51 [Google Scholar]
- Morgenroth, O. 1935, Astron. Nachr., 255, 425 [NASA ADS] [CrossRef] [Google Scholar]
- Murphy, S. J., & Shibahashi, H. 2015, MNRAS, 450, 4475 [Google Scholar]
- Murphy, S. J., Hey, D., Van Reeth, T., & Bedding, T. R. 2019, MNRAS, 485, 2380 [NASA ADS] [CrossRef] [Google Scholar]
- Nelson, R. H. 2011, Inf. Bull. Var. Stars, 5994, 1 [NASA ADS] [Google Scholar]
- Newville, M., Otten, R., Nelson, A., et al. 2019, https://doi.org/10.5281/zenodo.3588521 [Google Scholar]
- Ouazzani, R. M., Lignières, F., Dupret, M. A., et al. 2020, A&A, 640, A49 [NASA ADS] [CrossRef] [EDP Sciences] [Google Scholar]
- Pedersen, M. G., Aerts, C., Pápics, P. I., et al. 2021, Nat. Astron., 5, 715 [NASA ADS] [CrossRef] [Google Scholar]
- Prat, V., Mathis, S., Buysschaert, B., et al. 2019, A&A, 627, A64 [NASA ADS] [CrossRef] [EDP Sciences] [Google Scholar]
- Prša, A., Harmanec, P., Torres, G., et al. 2016, AJ, 152, 41 [Google Scholar]
- Raghavan, D., McAlister, H. A., Henry, T. J., et al. 2010, ApJS, 190, 1 [Google Scholar]
- Rappaport, S. A., Kurtz, D. W., Handler, G., et al. 2021, MNRAS, 503, 254 [NASA ADS] [Google Scholar]
- Reyniers, K., & Smeyers, P. 2003a, A&A, 409, 677 [NASA ADS] [CrossRef] [EDP Sciences] [Google Scholar]
- Reyniers, K., & Smeyers, P. 2003b, A&A, 404, 1051 [NASA ADS] [CrossRef] [EDP Sciences] [Google Scholar]
- Ricker, G. R., Winn, J. N., Vanderspek, R., et al. 2015, J. Astron. Telesc. Instrum. Syst., 1, 014003 [Google Scholar]
- Saio, H., Bedding, T. R., Kurtz, D. W., et al. 2018, MNRAS, 477, 2183 [Google Scholar]
- Saio, H., Takata, M., Lee, U., Li, G., & Van Reeth, T. 2021, MNRAS, 502, 5856 [Google Scholar]
- Samadi Ghadim, A., Lampens, P., & Jassur, D. M. 2018, Acta Astron., 68, 425 [Google Scholar]
- Sana, H., de Mink, S. E., de Koter, A., et al. 2012, Science, 337, 444 [Google Scholar]
- Savedoff, M. P. 1951, AJ, 56, 1 [NASA ADS] [CrossRef] [Google Scholar]
- Scargle, J. D. 1982, ApJ, 263, 835 [Google Scholar]
- Sekaran, S., Tkachenko, A., Johnston, C., & Aerts, C. 2021, A&A, 648, A91 [NASA ADS] [CrossRef] [EDP Sciences] [Google Scholar]
- Shao, Y., & Li, X.-D. 2016, ApJ, 833, 108 [NASA ADS] [CrossRef] [Google Scholar]
- Southworth, J. 2008, MNRAS, 386, 1644 [NASA ADS] [CrossRef] [Google Scholar]
- Southworth, J. 2013, A&A, 557, A119 [NASA ADS] [CrossRef] [EDP Sciences] [Google Scholar]
- Southworth, J., Maxted, P. F. L., & Smalley, B. 2004, MNRAS, 351, 1277 [NASA ADS] [CrossRef] [Google Scholar]
- Southworth, J., Maxted, P. F. L., & Smalley, B. 2005, A&A, 429, 645 [NASA ADS] [CrossRef] [EDP Sciences] [Google Scholar]
- Southworth, J., Bowman, D. M., Tkachenko, A., & Pavlovski, K. 2020, MNRAS, 497, L19 [Google Scholar]
- Southworth, J., Bowman, D. M., & Pavlovski, K. 2021, MNRAS, 501, L65 [NASA ADS] [CrossRef] [Google Scholar]
- Soydugan, E., Soydugan, F., Demircan, O., & İbanoǧlu, C. 2006, MNRAS, 370, 2013 [NASA ADS] [CrossRef] [Google Scholar]
- Stassun, K. G., Oelkers, R. J., Pepper, J., et al. 2018, AJ, 156, 102 [Google Scholar]
- Steindl, T., Zwintz, K., & Bowman, D. M. 2021, A&A, 645, A119 [NASA ADS] [CrossRef] [EDP Sciences] [Google Scholar]
- Szewczuk, W., & Daszyńska-Daszkiewicz, J. 2018, MNRAS, 478, 2243 [Google Scholar]
- Szewczuk, W., Walczak, P., & Daszyńska-Daszkiewicz, J. 2021, MNRAS, 503, 5894 [NASA ADS] [CrossRef] [Google Scholar]
- Takata, M., Ouazzani, R. M., Saio, H., et al. 2020a, A&A, 644, A138 [NASA ADS] [CrossRef] [EDP Sciences] [Google Scholar]
- Takata, M., Ouazzani, R. M., Saio, H., et al. 2020b, A&A, 635, A106 [NASA ADS] [CrossRef] [EDP Sciences] [Google Scholar]
- Torres, G., Andersen, J., & Giménez, A. 2010, A&ARv, 18, 67 [Google Scholar]
- Van Beeck, J., Bowman, D. M., Pedersen, M. G., et al. 2021, A&A, 655, A59 [NASA ADS] [CrossRef] [EDP Sciences] [Google Scholar]
- Van Reeth, T., Tkachenko, A., & Aerts, C. 2016, A&A, 593, A120 [NASA ADS] [CrossRef] [EDP Sciences] [Google Scholar]
- Vos, J., Vučković, M., Chen, X., et al. 2019, MNRAS, 482, 4592 [NASA ADS] [CrossRef] [Google Scholar]
- Vuille, F., & Brassard, P. 2000, MNRAS, 313, 185 [NASA ADS] [CrossRef] [Google Scholar]
- Waelkens, C. 1991, A&A, 246, 453 [NASA ADS] [Google Scholar]
- Weinberg, N. N., Arras, P., & Burkart, J. 2013, ApJ, 769, 121 [NASA ADS] [CrossRef] [Google Scholar]
- Weiss, W. W., Rucinski, S. M., Moffat, A. F. J., et al. 2014, PASP, 126, 573 [Google Scholar]
- Whitney, B. S. 1959, AJ, 64, 258 [NASA ADS] [CrossRef] [Google Scholar]
- Wood, B. D., & Forbes, J. E. 1963, AJ, 68, 257 [NASA ADS] [CrossRef] [Google Scholar]
- Wu, T., & Li, Y. 2019, ApJ, 881, 86 [Google Scholar]
- Wu, T., Li, Y., Deng, Z.-M., et al. 2020, ApJ, 899, 38 [NASA ADS] [CrossRef] [Google Scholar]
- Zanazzi, J. J., & Wu, Y. 2021, AJ, 161, 263 [NASA ADS] [CrossRef] [Google Scholar]
- Zucker, S., Mazeh, T., & Alexander, T. 2007, ApJ, 670, 1326 [NASA ADS] [CrossRef] [Google Scholar]
All Tables
Overview of the measured frequencies, including the identified combinations (within a 3-σ limit).
Rotation rates νrot and buoyancy travel times Π0 for the best-fitting asymptotic g-mode patterns, with conservative error margins derived from the 99%-confidence interval.
All Figures
|
Fig. 1. TESS light curves of V456 Cyg from sectors 14 (top two panels) and 15 (bottom two panels). The data have been converted to relative magnitude and rectified to zero magnitude by subtraction of a straight-line fit to the data. |
| In the text | |
|
Fig. 2. Reduced light curve of V456 Cyg, phase-folded over the binary orbit. The eclipses are indicated in grey. Top: original light curve (black) with the best-fitting binary model (red). Bottom: residual light curve, called the pulsation light curve in this work. |
| In the text | |
|
Fig. 3. Lomb-Scargle periodograms of the reduced light curve of V456 Cyg. Top: periodogram of the full reduced light curve of V456 Cyg, with the harmonics of the orbital frequency νorb indicated by full light-blue lines. Middle: periodogram of the full pulsation light curve. The frequencies that were detected from this light curve (νa to νn in Table 2) are marked in red. Full and dashed lines mark the independent frequencies and combination frequencies, respectively. Bottom: periodogram of the out-of-eclipse part of the pulsation light curve. The frequencies that were detected from this light curve (ν1 to ν11 in Table 2) are marked in red. Full and dashed lines mark the independent frequencies and combination frequencies, respectively. The dash-dotted line is the only combination frequency that does not include the orbital frequency νorb. |
| In the text | |
|
Fig. 4. Best-fitting asymptotic g-mode pattern (dashed lines), with the measured independent pulsation frequencies (red full lines) and the Fourier transform of the residual light curve after prewhitening the measured pulsation frequencies. This is shown for both the full light pulsation curve (top) and the out-of-eclipse pulsation light curve (bottom). |
| In the text | |
|
Fig. 5. Amplitude (top) and phase (bottom) variability of the three dominant independent pulsations of V456 Cyg, measured from the out-of-eclipse residual light curve: ν2 (red downward triangles), ν3 (black circles) and ν4 (blue upward triangles). The eclipses are indicated in grey, with a dashed line marking their centres. |
| In the text | |
|
Fig. 6. Amplitude (top) and phase (bottom) variability of the combination frequency ν5 = ν2 + ν3 (blue circles), measured from the out-of-eclipse residual light curve, as a function of the orbital phase. These are compared with the relative amplitude scaling factor A2 ⋅ A3 and the sum of the parent frequency phases ϕ2 + ϕ3 (red downward triangles; e.g. Buchler et al. 1997; Vuille & Brassard 2000). |
| In the text | |
Current usage metrics show cumulative count of Article Views (full-text article views including HTML views, PDF and ePub downloads, according to the available data) and Abstracts Views on Vision4Press platform.
Data correspond to usage on the plateform after 2015. The current usage metrics is available 48-96 hours after online publication and is updated daily on week days.
Initial download of the metrics may take a while.